
User's Manual

Elpro Technologies 450U-E Wireless Ethernet Modem & Device Server User Manual
60 www.cooperbussmann.com/wirelessresources Rev Version 1.4.0
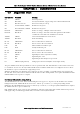
Routes: will display the current IP routes configured in the module.
IP statistics: show a number of statistics for each interface
TCP/UDP Statistics: shows the number of TCP and UDP connections currently established
Memory Statistics: shows the amount of memory available for each function.
Serial Statistics: shows the current status of each of the serial ports.
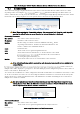
Network Traffic Analysis
There are many devices and PC programs that will analyse performance of an Ethernet network. A freely available
a simple cost effective means for more advanced analysis. By monitoring traffic on
the wired Ethernet, a better idea of regular traffic can be discovered.
Network Analysis programs make configuration of a filter for the 450U-E a simple task.
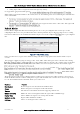
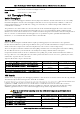
Channel Survey (Utilisation) 4.4
Channel Utilisation gives a visual display of how busy the current radio channel is over a given period of time.
Channel Utilisation is logged by the radio over three separate time intervals: 1 Second which will cover the last 60
seconds; 1 Minute which covers the last 60 minutes; and 1 Hour which covers the last 60 hours.
At any given time, an Access Point and its associated clients occupy a radio channel. This radio channel, or frequency,
may contain interference from other radio transmitters. When installing or diagnosing the 450U-E modem, the potential
capacity of a given radio channel will be reduced by the existence of these other interfering RF signals.
Channel Utilisation allows us to see how much RF activity is on a given channel as a percentage of the total utilisation.
When looking at the utilisation graph you need to look at the average percentage level rather than the peak bursts, also
look at the average percentage over a longer time period. If the graph shows bursts of 60-80% utilisation then this is
normal as the 450U-E uses the majority of the channel when transmitting due to the lowers bandwidth.
If most of the graph is filled to 60-80% then this would indicate there is excessive traffic. A channel that is very busy will
have high channel utilisation. Conversely a channel that is quiet will have low channel utilisation.
Channel Survey and Custom Survey can therefore be valuable tools to use when performing site surveys as it allows you
to determine how much of the frequency is being used. It is also a valuable diagnostics tool for identifying possible
sources of interference.
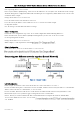
Channel Utilisation on a Live System:
Channel Utilisation can be used on a live system and is the simplest method for determining how busy the channel is and
to get an indication of how much spare capacity the channel has for additional data transfers. Performing a standard
Channel Survey Scan on a live system will show all Transmit & Receive packet from the system. It may also show
Transmit & Receive packet for other systems if they happen to be on the same frequency.
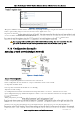
To identify possible interference on the current channel you can use the selection on the Custom Survey
page. If possible, temporarily disable all data transfer on the system, and if the Channel Utilisation remains high this will
confirm the presence of outside interference.
Diagnosing Low Throughput:
If normal communications between modems is poor, i.e. data throughput measurements from the previous section are
lower than estimated it could be attributed to interference. The Channel Utilisation graphs can be used to confirm how
much other radio traffic or interference is present. If the Channel Utilisation is high, then this could be the contributing
factor for the poor throughput performance. If the Channel Utilisation was low (indicating little interference), then this could
be attributed to a low RSSI, which can be checked on the Connectivity of the menu.