
User`s guide


Chapter 7 - Debug CARROLL TOUCH
7-2 Touch System Diagnostics (CTDIAG) User’s Guide
Debug Overview
Debug allows you to observe the SFP commands sent to the touch
system and the reports received from the touch system. For example, an
SFP command might be a request to the touch system for the current
touch coordinates and the associated report would be the actual touch
coordinates.
You can also use another debugger, based upon the Touch Application
Program Interface (TAPI), to monitor host/touch system
communication, as described in Chapter 8. Either approach produces
identical results, since the commands and reports are identical and only
the method of communication (not using or using TAPI) is different.
Note
For SBC troubleshooting, you must use the TAPI-based debugger.
The SBC hardware alone cannot communicate with SFP; it must
communicate through TAPI.
Debug Screen
To start a debug session, take the following steps:
1. From the Test Configuration Menu (Figure 3-1), press ENTER to
display the Test Menu.
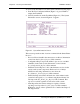
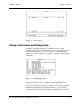
2. Select Debug from the Test Menu (Figure 4-1). The Debug screen,
shown in Figure 7-1, has two windows.
The transmit (Tx) window displays the SFP commands as they are
entered at the keyboard and sent from CTDIAG to the touch
system. Commands appear in low-intensity white (gray).
The receive (Rx) window displays the SFP commands that are
transmitted to, and the reports that are received from, the touch
system.