
User Manual


• Graph options
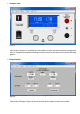
Settings for graph window. Depending on the device model, i.e. single or triple output, seperate
settings for the main outputs are possible here.
Figure 18
▪ Time Range
Selects the default time range of the graph‘s X axis. The graph window or windows can be
opened using the corresponding submenu item in menu „Action“. The time range setting
can be changed in the graph windows too, while the graph is stopped, but there the selec-
tion is only temporary.
▪ Auto-open graph on start
If this option is activated, the visualisation window or windows are automatically opened
with the application‘s control GUI. Default setting: deactivated.
▪ Auto-run graph with logging
The visualisation window or windows are automatically opened and the graph(s) will auto-
matically start running if this option activated and logging is started.
Default setting: deactivated.
▪ Auto-run graph with sequencing
The visualisation window or windows are automatically opened and the graph(s) will auto-
matically start running if this option activated and sequencing is started.
Default setting: deactivated.
Note: if both options „Start logging automatically with sequencing“ and „Autorun graph with
logging“ are activated and „Auto-run graph with sequencing is deactivated, the graph(s) will
start regardless together with sequencing.