
User Manual


Doc ID: BSEN
Date: 07-15-19
Page 17
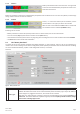
Auto scale Y
The Y axis of the plot area is usually set up for the full range of a ploed value. For example, if the
device has 5000 W of rated power, the scale for power would show from -5000 to 5000. When plong
low values, the resoluon could be too coarse so the plot rests around 0. With auto-scale acvated,
all visible scales are automacally and permanently adapted to the values currently visible in the 1
minute frame.
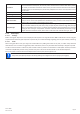
Clear plot Clears the plot area
Select background color Default is White, with black scales and grid. Can be switched to Black, with white scales and grid
Select plot color Allows to edit the plot colors
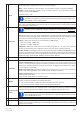
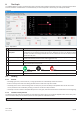
Show cursor value
This is acvated by default. On every plot, there is a cursor showing the plot value at a specic me
stamp. It can be used to read ploed values backwards in me, but also to read the precise value,
since it’s oen not possible to read values from the scales.
Select plot type
By default, a plot is drawn by connecng two points by a straight line (plot type “Line”). Depending
in the resoluon of me (X axis) and scale (Y axis), the plot may look smooth or edgy. With plot type
“Dot” the line between two points is not drawn and the parcular plot would appear as a thread of
rectangular dots. Plot type “Interpolated” calculates and draws intermediate points within longer
sample intervals and connects them, which results in the same view as drawn with type “Line”
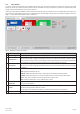
8.1.3 Data export
8.1.3.1 As image
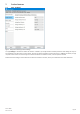
Buon “Save graph” exports the current Graph plot area anyme as an image le of either BMP or PNG format. You will only get a
snapshot of the momentary plot view, which represents all your customized sengs regarding plot color, plots visibility and scaling.
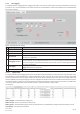
8.1.3.2 As le
When saving plot data to a le, you will get all recorded data since plong start and for all six plots, no maer if they have been
switched o or not. This acon is triggered by buon “Save data”, which is only accessible while the Graph is stopped or paused.
The le is saved as text le in CSV format, with a headline and any number of rows between 1 and 20,000. The Graph records a
maximum of 20,000 data points for every plot aer every start. The actual recorded number is not indicated anywhere.
Every row of data in the le contains the sampled values of all six plots, without physical unit.
The format of the le exported from the Graph plong area is dierent to the one you get from Logging!