
User Manual


Doc ID: BSEN
Date: 07-15-19
Page 16
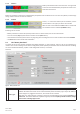
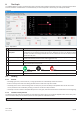
8. The Graph
The soware features a graph, a windows with a plot area which draw mulple colored plots over me, represenng actual values
from the simulaon. The data which is recorded this way can also be exported in several ways, for example as CSV le.
Overview:
Figure 8 - Graph window
Nr Element Descripon
1 Show plots
Deacvate/acvate single plots on the drawing area. By default, all plots are acvated. Via a
context menu it also allows to change the plot colors. Switching any plot on or o doesn’t aect
the data recorded in the background and which can be saved to le. The le will always contain
all data from all plots.
2 Threshold to stop plong
Separately selectable/deselectable thresholds for the 6 plots to stop plong upon reaching any.
If several are selected, the rst one to reach triggers the stop.
3 Sample interval Time between two ploed values. Default interval is 500 ms, range is 100 ms...99h59m59s999ms
4 Control elements for the plot area
5
Graph control:
Start Pause Stop
6 Graph plot area
7 Measured values The plots in real values with minimum, maximum and average since plot start.
8.1 Handling
8.1.1 General
• All sengs (plot color, interval me etc.) in the graph window are automacally stored and restored
• Plots can overlay each other when having idencal values so that some may seem hidden
• The Graph plots in the so-called scrolling mode. It means, the plot area will always show ploed values of the last minute.
Earlier plot data can be visualized by scrolling on the X axis to the le in Stop condion.
• The Graph records a maximum of 20,000 data points for every plot, aer that the data will be overwrien from the beginning
8.1.2 Funcons of the plot area
The Graph’s plot area draws up to 6 plots at the same me from le to right. It also visualizes adaptable scales on the sides, plus a
cursor and a me stamp. For the plot area, there are some opons for customize the view.
Level 1 Level 2 / Descripon