
User's Manual Part 3

Points Scale
Absolute Time Scale
This command can also be accessed by right-clicking the
scale on the Data Graph and select Set Time (X) Scale
from the shortcut menu.
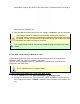
5.5.9.4. Add Time (X) Reference Lines
Time Reference Lines are colored vertical lines that can be positioned anywhere within
the range of X-values on the Data Graph.
These reference lines indicate the temperature values at the intersection of a Data Plot
with each displayed reference line.
This is available when in Engineer Mode.
To add Time Reference Lines to the Data Graph:
1) On the Profile menu, click Add Time (X) Reference Line.
2) Select the line color by clicking the line button below the label.