
User's Manual Part 3
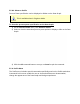

3) Select the line color by clicking the line button below the label.
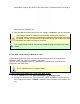
When an reference line is displayed on the Data Graph, the default label is the
specified temperature. The software allows the user to rename the line by
using the Optional Name text box.
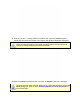
4) Click the OK command to accept the new settings or Cancel to quit the command.
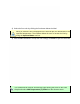
This command can also be accessed by right-clicking the scale on the Data
Graph and select Add Temperature (Y) Scale from the shortcut menu.