
User's Manual Part 3

temperature settings are visible in the Data Graph. In Manual mode, the range of
values must be manually set.
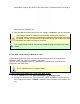
3) Click the OK command button to use the settings or Cancel to quit the command.
The software allows the ability to include recipe values when using the
Autoscale feature. Instead of automatic
ally scaling the Data Graph to the data
run profile, it scales it to include the recipe values along with profile so the data
will always be visible and easy to work with.
This command can also be accessed by double-clicking the scale on the Data
Graph.
5.5.9.2. Add Temperature (Y) Reference Lines
Temperature Reference Lines are colored horizontal lines and can be positioned
anywhere within the range of Y-values in the graph.
They are used for analysis when the Temperature (Y) parameter calculations are
displayed in the Data Table.
This is available when in Engineer Mode.
To add Temperature Reference Lines to the Data Graph:
1) On the Profile menu, click Add Temperature (Y) Reference Line.
2) Choose the reference line Type (Fixed and Linked). If Fixed is selected, enter a
fixed Temperature value. If Linked is selected, select a portion of the profile to link
it to.