
User's Manual Part 3
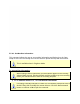
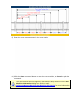

5) Set the Zone Temperatures in the zone matrix. These temperatures could be the
upper and lower thresholds of acceptable temperatures to meet process standards
or temperature settings of upper and lower heat sources. Upper zone
temperatures appear as solid lines and lower zones appear as dotted lines on the
Data Graph.
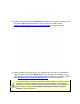
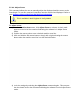
6) Click the OK command button to set the machine information, or Cancel to quit the
command.
To view the machine information on the Data Graph, the Show on Profile
settings must be enabled. Refer to topic Software>Menus>Machine>Show
on Profile for more information.
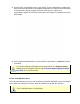
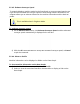
5.5.6.2. View Machine Oven
This command allows the user to view machine information displayed on the Data Graph
so the user can visually see how the data run profile lines up with the machine.
This is available when in Verify Mode.