
User's Manual Part 3
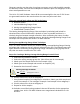
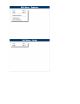

Cpk
≥
1.33: Data well inside spec limits.
Cp = 1.00: Data fills entire spec range.
Cpk = 1.00: Data fills entire spec range.
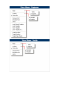
Cp > 1.00: Data tightly distributed. If it
were centered between the spec limits,
no data would lie beyond those limits.
Cpk < 1.00: Some data is outside the
spec limits.
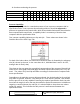
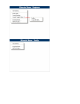
Cp < 1.00: Data not tightly distributed. If it
were centered between the spec limits,
some data would still lie outside those
limits.
Cpk < 1.00: Some data is outside the
spec limits.
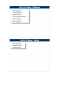
The equations used to calculate the index values are as follows:
O
R
, whichever is less
As can be interpreted from the above equations, Cp gives an indication of how narrow the
data distribution is relative to the width of the specification limits. Essentially, it indicates
how well the process would be able to stay within the specified limits if the data were
perfectly centered between those limits.
Cpk compares the widest half of the data distribution to the appropriate specification limit.
It indicates whether the process is capable of meeting the specification as indicated by
.).(*6 DevStd
LSLUSL
Cp
−
=
.).(*3 DevStd
xUSL
Cpk
−
=
.).(*3 DevStd
LSLx
Cpk
−
=