
User's Manual Part 3

Short runs may be runs that take a long time to process, runs in which multiple samples
are difficult to collect, and runs where samples are difficult to place into subgroups or runs
where small quantities are run.
The M.O.L.E.® MAP Software charts will be more meaningful to the user if SPC charts
are generated based on data sets that have the same set points each time.
There are several basic short run SPC techniques:
1. Nominals Charts
2. Individuals/Moving Range Charts
3. Moving Average/Moving Range Charts
4. Standardized Formula Charts
The Moving Average/Moving Range Chart technique is particularly well suited for
situations where control information is desired as soon as possible and there is a
relatively long time between sample collections. After considering the nature of solder
operations and the machine sampling process, the Moving Average/Moving Range Chart
technique was incorporated into M.O.L.E.® MAP Software.
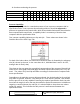
Moving Average/Moving Range Chart Technique:
M.O.L.E.® MAP Software utilizes the standard Moving Average/Moving Range Charting
technique with a subgroup size of 2-6 that is selected by the user. The following steps and
figure illustrates the Moving Average/Moving Range calculations (using a group size of
two) that are used to construct the SPC chart.
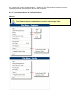
Steps for Creating a Moving Average Moving Range Control Chart:
1. Select the key variable to monitor.
2. Select the moving average group size. (We will use two in our example.)
3. Obtain your first sample and record it as sample 1 (X1).
4. Obtain your second sample and record it as sample 2 (X2).
5. Determine the x-bar and R values.
Moving Average formulas:
6. Plot this value on the chart as subgroup 1.
7. Carry forward sample 2 into subgroup 2’s calculation. Obtain your third sample and
record it as sample 3. The averages of sample 2 and sample 3 form subgroup 2.
8. Plot this value on the chart as subgroup 2.
9. Repeat for all the samples.
10. Calculate control limits using standard x-bar and R formulas for the appropriate
sample sizes. M.O.L.E.® MAP Software uses range-based calculations for LCL
and UCL.
X
1
+ X
2
2
X =
(Range)R=X - X
H
L