
User's Manual Part 2
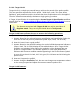

The calculation numbers vary depending on the data in the Spreadsheet Page
Tab. Using the filter function or the hide command allows the user to select the
specific data runs to include on the SPC chart.
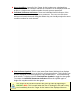
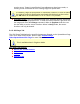
5.4.5.4. Statistics Box
The Statistics Box reflects the current SPC data from the selected, sorted and filtered
data set parameter.
Statistics box data:
• N = Number of subgroups.
• Min. = The lowest data point on the graph.
• Max. = The highest data point on the graph.
• X-2 bar = The current X-Bar Bar calculation.
• Std. Dev.= The Standard Deviation of the selected parameter.
• Cp; Cpk = Process capability indeces (Refer to Appendix B for more
information).