
User's Manual Part 2
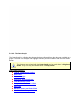

5.4.4.2. The Data Graph
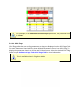
The Data Graph is a display that shows the data collected from the data run overlaid on a
graph. The user can analyze and highlight various process features with the tools listed
below.
The features associated with the Data Graph can be used when in Engineer
mode. They can only be viewed when in Verify mode.
Data Graph features:
Time & Temperature Scales
Data Plots
Process Origin
Conveyor Speed Indicator
Time Reference Lines
Temperature Reference Lines
Map Data
Machine Zones and Zone Sizes
Machine Zone Temperatures