
User's Manual Part 3


♦303♦ MEGAM.O.L.E.® Help System Guide
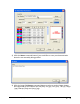
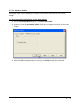
5) Enter the test assembly board length, width and thickness.
6) Enter the sensor location descriptions. These descriptions can be the location
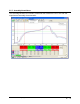
where each sensor is connected to the test product. The channel color
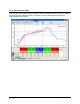
associated with the description indicates which Data Plot on the Data Graph it
represents.
Thermocouple placement information entered in the sensor location matrix are
also displayed as the Sensor Locations in the Data Table.
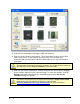
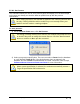
7) Enter sensor location dimensions. Sensor Locations can also be set by dragging
sensor location markers on the selected image. To move the markers, click the
Enlarge command button below the assembly image and the Set Sensor
Locations dialog box appears.
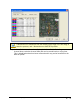
Specified X-dimensions may be altered when using the Align Profile Peaks
command to align the data run profile lines. Refer to topic
Software>Menus>Profile>Align Profile Peaks for more information.