
User's Manual Part 3


♦365♦ MEGAM.O.L.E.® Help System Guide
11. Continue monitoring the process.
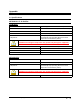
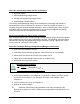
SAMPLE # 1 2 3 4 5 6 7 8 9 10 11 12 13 14 15 16
SAMPLE MEASUREMENTS 3 4 5 3 2 9 5 2 6 8 4 8 5 6 3 3
SUBGROUP VALUE x 3.5 4.5 4 2.5 5.5 7 3.5 4 7 6 6 6.5 5.5 4.5 3
R 1 1 2 1 7 4 3 4 2 4 4 3 1 3 0
Moving Average/Moving Range Subgroup Size 2 Calculations Chart
Process Capability
A process capability index is a standard measure of how a process compares with its
specification limits—how a process is performing relative to how it is supposed to
perform. As opposed to the control chart, which shows detailed information about how
the data compares with control limits, a capability index is a summary of how the data
compares with the specification limits.
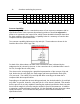
Two common capability indicators are Cp and Cpk. These values are shown in the
Statistics Box on the SPC Page Tab.
For both of the index values, the data used to determine them is dictated by the
subgroup size (N) chosen by the user. In the case where N=1, individual data is used—
for N>1, average data is used (x bar).
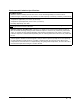
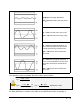
The charts on the next page give a graphical representation of the concept of Cp and
Cpk. Notice that in each graph, the same upper and lower specification limits (USL,
LSL) are used. The values of Cp and Cpk will differ according to the data that is
compared with those specifications.
Depending on the particular process being monitored, the desired value for Cp and Cpk
may differ. In general, however, a Cp and Cpk of 1.33 or above is desired. This assures
that the process is not only capable of meeting the required specification limits, but also
has a built-in margin for error that may be needed in special circumstances. In addition
to targeting a certain minimum Cp and Cpk, it is also desirable to have these two values
equal one another. This indicates that the process is well-centered between the
specification limits.