
User's Manual Part 3


MEGAM.O.L.E.® Help System Guide ♦364♦
There are several basic short run SPC techniques:
1. Nominals Charts
2. Individuals/Moving Range Charts
3. Moving Average/Moving Range Charts
4. Standardized Formula Charts
The Moving Average/Moving Range Chart technique is particularly well suited for
situations where control information is desired as soon as possible and there is a
relatively long time between sample collections. After considering the nature of solder
operations and the machine sampling process, the Moving Average/Moving Range
Chart technique was incorporated into MAP Software.
Moving Average/Moving Range Chart Technique:
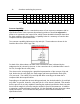
MAP Software utilizes the standard Moving Average/Moving Range Charting technique
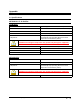
with a subgroup size of 2-6 that is selected by the user. The following steps and figure
illustrates the Moving Average/Moving Range calculations (using a group size of two)
that are used to construct the SPC chart.
Steps for Creating a Moving Average Moving Range Control Chart:
1. Select the key variable to monitor.
2. Select the moving average group size. (We will use two in our example.)
3. Obtain your first sample and record it as sample 1 (X1).
4. Obtain your second sample and record it as sample 2 (X2).
5. Determine the x-bar and R values.
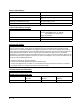
Moving Average formulas:
X
1 +
X
2
2
X =
(
Ran
g
e
)
R=X - X
H
L
6. Plot this value on the chart as subgroup 1.
7. Carry forward sample 2 into subgroup 2’s calculation. Obtain your third sample
and record it as sample 3. The averages of sample 2 and sample 3 form
subgroup 2.
8. Plot this value on the chart as subgroup 2.
9. Repeat for all the samples.
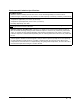
10. Calculate control limits using standard x-bar and R formulas for the
appropriate sample sizes. MAP Software uses range-based calculations for LCL
and UCL.