
User's Manual Part 2

♦149♦ MEGAM.O.L.E.® Help System Guide
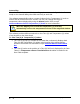
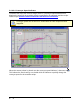
Autoscaling:
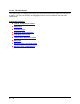
The software includes a powerful Autoscaling option to automatically scale the Data
Graph so the data will always be visible and easy to work with.
The software automatically selects a range of values for the Temperature (Y) scale to
ensure that all the data fits on the screen. The user can change the range of
temperature values displayed by using the Manual mode. Refer to topic
Software>Menus>Profile>Temperature (Y) Scale for more information.
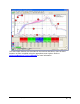
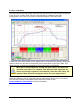
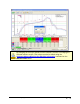
When the Magnify tool is used the Temperature (Y) scale will
automatically scale to the temperatures viewed in the magnified window.
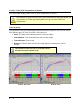
The software provides different methods to view Time (X) and Temperature (Y) values
of any location on the Data Graph.
To view Time (X) & Temperature (Y) values:
• The Time (X)/Temp (Y) Readout in the Status bar continuously displays both
Time (X) and Temperature (Y) values at the location of the mouse pointer.
Details of this feature are described in topic Software>Menus>View>Status
Bar.
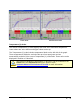
• The Time (X) value at the position of a Time (X) Ref line is displayed in the Data
Table if a Temperature value at Time Reference calculation is loaded in the
Data Table template.