
Technical data


94
XLOG trace mode
The following trace information is accessible via the XLOG interface:
• D-channel traces
• B-channel traces (first 24 bytes)
• Layer 1 interface events
• Layer 2 events
• Debug information
You can access this information using the following commands:
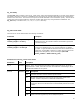
Command Description
divactrl load -c <x> -
ReadXlog
Reads XLOG information from board <x>, decodes it, and prints it to standard output.
divactrl load -c <x> -
ReadXlog -File <y>.txt
Reads XLOG information from board <x>, decodes it, and writes it to file <y>.txt.
The shellscript divalog provides an abbreviation for divactrl -ReadXlog. Note that this is
different from the similar named "divalogd" accounting utility on page 73.
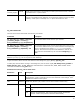
divactrl load -c <x> -
FlushXlog
Reads XLOG information from board <x>, decodes it, and prints it to standard output.
Exits after no more XLOG messages are available.
divactrl load -c <x> -
FlushXlog -File <y>.txt
Reads XLOG information from board <x>, decodes it, and writes it to file <y>.txt. Exits
after no more XLOG messages are available.
Core dump generation mode
If the Dialogic
®
Diva
®
Media Board state is changed to trapped [17] and you cannot access the Diva Media
Board's debug or trace information via XLOG, i.e., board firmware problem, you can create a core dump of the
board memory. This file can be used by the Dialogic Customer Support to extract debug information and analyze
the board's state.
To find out the state of a logical adapter <x>, execute: /usr/lib/opendiva/divas/divactrl load -c <x> -
CardState.
To generate a core dump of the Diva Media Board <x> and store it to the file core.bin, execute:
/usr/lib/opendiva/divas/divactrl load -c <x> - CoreDump -File core.bin. [18]
Execute this command after the Dialogic
®
Diva
®
Media Board is in a trapped state.