
User`s manual


- 36 -
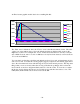
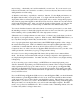
An Excel scatter graph from this data looks something like this:
-1000
0
1000
2000
3000
4000
5000
0 20000 40000 60000 80000 100000 120000 140000
FAlt
FVeloc
LDA
LowV
Apogee
N-O
Drogue
Main
The “FAlt” trace is altitude @ time, the “FVeloc” trace is the filtered altitude @ time. The other
“spikes” are event markers; they point to the altitude and time at which specific events in the
flight have occurred. For example, the “LowV” marker shows that the Low Velocity event (the
end of Mach Lockout, after 1 second of <100 ft/sec velocity has been detected) occurred at about
17 seconds and 4400 feet.
You can clearly see that the rocket hits peak altitude at about 18 seconds, and maximum velocity
at about 3 seconds. Note that the velocity graph is jaggedy compared to the altitude graph; this is
due to the aforementioned issues with deriving velocity from barometric pressure. The important
thing is that you can see clearly where the velocity peaks then drops sharply; this is where the
motor burned out and aero drag immediately started to slow the rocket. You can also see where
the drogue ejection charge fired about a second after apogee and the rocket starts to slow. The
CHA (main) channel fired at about 94 seconds at about 500’