
User manual
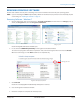


Procedure for Viewing a Graph
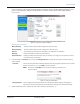
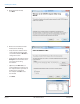
1. On the Prole Extraction
screen, click the + next to
the endpoint number in the
Select To View list to see the
prole data le(s).
2. Click a le to select it.
Result: A graph of the file
automatically opens to the
right of the Select To View list.
Figure 59: Select To View list with file selected
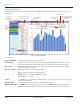
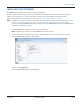
3. If available, select a unit of
measure using the
drop-down menu to change
the Y-axis value.
4. Use the buttons at the top
of the screen to change the
time period for a dierent
graph display. The X-axis will
update accordingly.
Figure 60: Profile data by hour
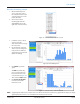
5. Click PRINT to print the
graph.
To SAVE the prole data,
place a check mark in the
box next to the le in the
Select To View list (Figure 61).
Then click the SAVE button.
6. Click Extract Prole Data
to return to the Prole
Extraction screen.
Figure 61: Select To View list with file checked
OTE:N A graph displays when there is data. If there is no data for the time period selected, a graph will not display. An empty
graph displays when there is no consumption for the time period selected.
Prole Extraction
Page 43 February 2015 ORI-UM-00019-EN-04