
User manual


Viewing Prole Data
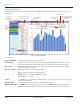
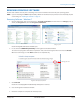
Saved profile data can be viewed in a bar graph format in the ORION Endpoint Utility. An example of a profile data graph is
shown below.
Figure 58: Profile data graph
Graph Details
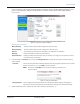
Extract Profile Data Click to return to the Profile Extraction screen.
Select To View Endpoint numbers with saved profile data are displayed in ascending numerical order. Click + to
display saved files for the endpoint. Then click a file to display a bar graph of the profile data.
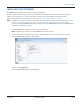
Units (Y-axis) When unit of measure is available, a drop-down menu will display. Select from the drop-down
menu to change the Y-axis value.
Time Period (X-axis) Hour: Displays a day of data, divided into hours.
Day: Displays a month of data, divided into days.
Month: Displays a year of data, divided into months.
Year: Displays a year of data.
<Today> Click Today to see a graph of the profile data for the current day. Use the arrows to view a graph of
the previous or next day.
Date Drop-Down Click the drop-down arrow to display a calendar and select a date.
IMPORT, PRINT, SAVE Use IMPORT to access and import a profile data file. Use PRINT to print the current graph. Use
SAVE to save the profile data. The file in the Select To View list must have a check mark to save.
List of saved
endpoint profile
data files
Click to return to Profile
Extraction screen
Endpoint serial
number and date
of profile data
IMPORT a profile
data file
PRINT the graph
SAVE profile data -file must
be checked in the Select To
View list
Click + to
expand
and see
files
Click check box
to save file
Units of measure
(if available)
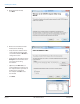
To see consumption data,
hover over the graph with the
mouse
Prole Extraction
Page 42 February 2015ORI-UM-00019-EN-04