
User guide

71
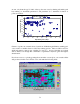
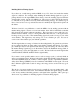
are run, only chart the top 5%-20% of the top best test cases by charting sell ranking and
buy ranking (or AccuTrack parameter 1 and parameter 2) to determine if clusters of
points are formed:
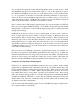
Best 10% of Test Cases
10
15
20
25
30
35
40
45
50
10 15 20 25 30 35 40 45 50
Buy Ranking Period, Days
Sell Ranking Period, Days
Clusters of points are centered about a band from 14/40 through 25/40 day ranking peri-
ods as well as a smaller cluster at 19/35 day ranking periods. These would be areas for
additional analysis (draw down, switches per year etc.). Avoid points that are isolated
such as 20/25, even though this combination of parameters may have given the highest
annual return.
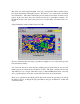
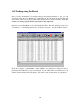
If you have access to a plotting package that can make contour plots, you can take all the
data produced, in this case 1524 test cases, and make the following chart: