
Manual


44
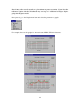
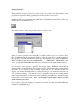
The Out-of-Sample (OS) Results screen adds a new line at the end of each generation.
When we refer to “Average” values, we are referring to a simple average of the ten best
systems that have been found. Note: A common misunderstanding is that the ten best
systems were all found in the current generation. This is not the case. For example, at
the end of generation 8, there are ten “best” systems found and saved. These best
systems could have been found in any of the eight generations evaluated. This will
become clearer after running the examples in the next chapter.
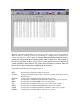
Each summary line has the following information:
GEN Generation for which the results are reported
IS ANN Average In-Sample return for the top ten best systems found at the end of
the generation
OS ANN Average Out-of-Sample return for the top ten systems
UPI Average Out-of-Sample Ulcer Performance index for the top ten systems
MDD Average Out-of-Sample MDD for the top ten systems
S/Y Average Out-of-Sample switches per year for the top ten systems
BETA Average Out-of-Sample maximum Beta for the top ten systems
CORR Average Out-of-Sample maximum Correlation for the top ten systems
ALPHA Average Out-of-Sample Alpha for the top ten systems