
Web Management Guide-R02
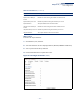
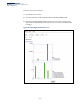
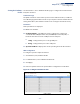
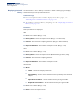
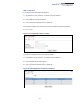
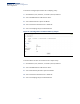
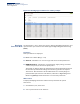
Table Of Contents
- How to Use This Guide
- Contents
- Figures
- Tables
- Getting Started
- Web Configuration
- Using the Web Interface
- Basic Management Tasks
- Displaying System Information
- Displaying Hardware/Software Versions
- Configuring Support for Jumbo Frames
- Displaying Bridge Extension Capabilities
- Managing System Files
- Setting the System Clock
- Configuring the Console Port
- Configuring Telnet Settings
- Displaying CPU Utilization
- Configuring CPU Guard
- Displaying Memory Utilization
- Resetting the System
- Interface Configuration
- VLAN Configuration
- Address Table Settings
- Spanning Tree Algorithm
- Congestion Control
- Class of Service
- Quality of Service
- VoIP Traffic Configuration
- Security Measures
- AAA (Authentication, Authorization and Accounting)
- Configuring User Accounts
- Web Authentication
- Network Access (MAC Address Authentication)
- Configuring HTTPS
- Configuring the Secure Shell
- Access Control Lists
- Filtering IP Addresses for Management Access
- Configuring Port Security
- Configuring 802.1X Port Authentication
- DoS Protection
- DHCP Snooping
- DHCPv6 Snooping
- ND Snooping
- IPv4 Source Guard
- IPv6 Source Guard
- ARP Inspection
- Application Filter
- Basic Administration Protocols
- Configuring Event Logging
- Link Layer Discovery Protocol
- Simple Network Management Protocol
- Configuring Global Settings for SNMP
- Setting Community Access Strings
- Setting the Local Engine ID
- Specifying a Remote Engine ID
- Setting SNMPv3 Views
- Configuring SNMPv3 Groups
- Configuring Local SNMPv3 Users
- Configuring Remote SNMPv3 Users
- Specifying Trap Managers
- Creating SNMP Notification Logs
- Showing SNMP Statistics
- Remote Monitoring
- Setting a Time Range
- Ethernet Ring Protection Switching
- MLAG Configuration
- OAM Configuration
- LBD Configuration
- Multicast Filtering
- Overview
- Layer 2 IGMP (Snooping and Query for IPv4)
- Configuring IGMP Snooping and Query Parameters
- Specifying Static Interfaces for a Multicast Router
- Assigning Interfaces to Multicast Services
- Setting IGMP Snooping Status per Interface
- Filtering IGMP Packets on an Interface
- Displaying Multicast Groups Discovered by IGMP Snooping
- Displaying IGMP Snooping Statistics
- Filtering and Throttling IGMP Groups
- MLD Snooping (Snooping and Query for IPv6)
- Configuring MLD Snooping and Query Parameters
- Setting Immediate Leave Status for MLD Snooping per Interface
- Specifying Static Interfaces for an IPv6 Multicast Router
- Assigning Interfaces to IPv6 Multicast Services
- Filtering MLD Query Packets on an Interface
- Showing MLD Snooping Groups and Source List
- Displaying MLD Snooping Statistics
- Filtering and Throttling MLD Groups
- Multicast VLAN Registration for IPv4
- IP Tools
- IP Configuration
- General IP Routing
- IP Services
- Appendices

Chapter 4
| Interface Configuration
Port Configuration
– 116 –
Displaying Statistical
History
Use the Interface > Port > History or Interface > Trunk > History page to display
statistical history for the specified interfaces.
Command Usage
◆ For a description of the statistics displayed on these pages, see
“Showing Port or Trunk Statistics” on page 110.
◆ To configure statistical history sampling, use the “Displaying Statistical
History” on page 116.
Parameters
These parameters are displayed:
Add
◆ Port – Port number. (Range: 1-18)
◆ History Name – Name of sample interval. (Range: 1-31 characters)
◆ Interval - The interval for sampling statistics. (Range: 1-86400 minutes)
◆ Requested Buckets - The number of samples to take. (Range: 1-96)
Show
◆ Port – Port number. (Range: 1-18)
◆ History Name – Name of sample interval. (Default settings: 15min, 1day)
◆ Interval - The interval for sampling statistics.
◆ Requested Buckets - The number of samples to take.
Show Details
◆ Mode
■
Status – Shows the sample parameters.
■
Current Entry – Shows current statistics for the specified port and named
sample.
■
Input Previous Entries – Shows statistical history for ingress traffic.
■
Output Previous Entries – Shows statistical history for egress traffic.
◆ Port – Port number. (Range: 1-18)
◆ Name – Name of sample interval.