ECS4810-12M Layer 2 Gigabit Ethernet Switch Web Management Guide Software Release v1.2.0.1 www.edge-core.
Web Management Guide ECS4810-12M Gigabit Ethernet Switch Layer 2 Gigabit Ethernet Switch with 12 Gigabit Combination Ports (RJ-45/SFP) ECS4810-12M E102016/ST-R05 149100000142A
How to Use This Guide This guide includes detailed information on the switch software, including how to operate and use the management functions of the switch. To deploy this switch effectively and ensure trouble-free operation, you should first read the relevant sections in this guide so that you are familiar with all of its software features. Who Should Read This guide is for network administrators who are responsible for operating and this Guide? maintaining network equipment.
How to Use This Guide For information on how to install the switch, see the following guide: Installation Guide For all safety information and regulatory statements, see the following documents: Quick Start Guide Safety and Regulatory Information Conventions The following conventions are used throughout this guide to show information: Note: Emphasizes important information or calls your attention to related features or instructions.
How to Use This Guide Revision Date v1.1.4.11 5/2014 v1.1.4.
How to Use This Guide Revision Date v1.1.4.
Contents Section I How to Use This Guide 3 Contents 7 Figures 19 Tables 33 Getting Started 35 1 Introduction Section II 37 Key Features 37 Description of Software Features 38 System Defaults 43 Web Configuration 47 2 Using the Web Interface 49 Connecting to the Web Interface 49 Navigating the Web Browser Interface 50 Home Page 50 Configuration Options 51 Panel Display 51 Main Menu 52 3 Basic Management Tasks 71 Displaying System Information 72 Displaying Hardware/Sof
Contents Managing System Files 77 Copying Files via FTP/TFTP or HTTP 77 Saving the Running Configuration to a Local File 79 Setting the Start-up File 80 Showing System Files 80 Automatic Operation Code Upgrade 81 Setting the System Clock 85 Setting the Time Manually 85 Setting the SNTP Polling Interval 86 Specifying SNTP Time Servers 87 Setting the Time Zone 88 Configuring Summer Time 89 Configuring the Console Port 91 Configuring Telnet Settings 93 Displaying CPU Utilization 9
Contents Displaying LACP Settings and Status for the Remote Side 138 Configuring Load Balancing 139 Saving Power 141 Traffic Segmentation 143 Enabling Traffic Segmentation 143 Configuring Uplink and Downlink Ports 144 VLAN Trunking 146 5 VLAN Configuration 149 IEEE 802.1Q VLANs 149 Configuring VLAN Groups 152 Adding Static Members to VLANs 155 Configuring Dynamic VLAN Registration 159 Showing VLAN Statistics 162 IEEE 802.
Contents Configuring Loopback Detection 198 Configuring Global Settings for STA 200 Displaying Global Settings for STA 205 Configuring Interface Settings for STA 206 Displaying Interface Settings for STA 211 Configuring Multiple Spanning Trees 214 Configuring Interface Settings for MSTP 218 8 Congestion Control 221 Rate Limiting 221 Storm Control 222 Automatic Traffic Control 224 Setting the ATC Timers 226 Configuring ATC Thresholds and Responses 227 9 Class of Service 231 Layer
Contents 12 Security Measures 269 AAA (Authentication, Authorization and Accounting) 270 Configuring Local/Remote Logon Authentication 271 Configuring Remote Logon Authentication Servers 272 Configuring AAA Accounting 277 Configuring AAA Authorization 282 Configuring User Accounts 286 Web Authentication 288 Configuring Global Settings for Web Authentication 288 Configuring Interface Settings for Web Authentication 289 Network Access (MAC Address Authentication) 290 Configuring Global
Contents Configuring ACL Mirroring 330 Showing ACL Hardware Counters 331 ARP Inspection 332 Configuring Global Settings for ARP Inspection 333 Configuring VLAN Settings for ARP Inspection 335 Configuring Interface Settings for ARP Inspection 337 Displaying ARP Inspection Statistics 338 Displaying the ARP Inspection Log 339 Filtering IP Addresses for Management Access 340 Configuring Port Security 342 Configuring 802.1X Port Authentication 344 Configuring 802.
Contents Displaying LLDP Local Device Information 387 Displaying LLDP Remote Device Information 390 Displaying Device Statistics 399 Simple Network Management Protocol 401 Configuring Global Settings for SNMP 403 Setting the Local Engine ID 404 Specifying a Remote Engine ID 405 Setting SNMPv3 Views 407 Configuring SNMPv3 Groups 409 Setting Community Access Strings 415 Configuring Local SNMPv3 Users 417 Configuring Remote SNMPv3 Users 419 Specifying Trap Managers 422 Creating SNMP
Contents Transmitting Link Trace Messages 491 Transmitting Loop Back Messages 492 Transmitting Delay-Measure Requests 494 Displaying Local MEPs 496 Displaying Details for Local MEPs 497 Displaying Local MIPs 499 Displaying Remote MEPs 500 Displaying Details for Remote MEPs 501 Displaying the Link Trace Cache 503 Displaying Fault Notification Settings 505 Displaying Continuity Check Errors 506 OAM Configuration 507 Enabling OAM on Local Ports 507 Displaying Statistics for OAM Messa
Contents Showing the IPv6 Neighbor Cache 540 Showing IPv6 Statistics 541 Showing the MTU for Responding Destinations 547 15 IP Services 549 Domain Name Service 549 Configuring General DNS Service Parameters 549 Configuring a List of Domain Names 550 Configuring a List of Name Servers 552 Configuring Static DNS Host to Address Entries 553 Displaying the DNS Cache 554 Dynamic Host Configuration Protocol 555 Specifying a DHCP Client Identifier 555 Configuring DHCP Relay Service 557 E
Contents Setting Immediate Leave Status for MLD Snooping per Interface 598 Specifying Static Interfaces for an IPv6 Multicast Router 599 Assigning Interfaces to IPv6 Multicast Services 601 Showing MLD Snooping Groups and Source List 603 Multicast VLAN Registration for IPv4 Configuring MVR Global Settings 606 Configuring MVR Domain Settings 608 Configuring MVR Group Address Profiles 609 Configuring MVR Interface Status 612 Assigning Static MVR Multicast Groups to Interfaces 614 Displaying
Contents Glossary 653 Index 661 – 17 –
Contents – 18 –
Figures Figure 1: Home Page 50 Figure 2: Front Panel Indicators 51 Figure 3: System Information 72 Figure 4: General Switch Information 74 Figure 5: Configuring Support for Jumbo Frames 75 Figure 6: Displaying Bridge Extension Configuration 76 Figure 7: Copy Firmware 78 Figure 8: Saving the Running Configuration 79 Figure 9: Setting Start-Up Files 80 Figure 10: Displaying System Files 81 Figure 11: Configuring Automatic Code Upgrade 84 Figure 12: Manually Setting the System Clock 86
Figures Figure 30: Displaying Local Port Mirror Sessions 108 Figure 31: Configuring Remote Port Mirroring 108 Figure 32: Configuring Remote Port Mirroring (Source) 111 Figure 33: Configuring Remote Port Mirroring (Intermediate) 112 Figure 34: Configuring Remote Port Mirroring (Destination) 112 Figure 35: Showing Port Statistics (Table) 115 Figure 36: Showing Port Statistics (Chart) 116 Figure 37: Configuring a History Sample 118 Figure 38: Showing Entries for History Sampling 118 Figure 3
Figures Figure 65: Configuring VLAN Trunking 146 Figure 66: Configuring VLAN Trunking 148 Figure 67: VLAN Compliant and VLAN Non-compliant Devices 151 Figure 68: Using GVRP 152 Figure 69: Creating Static VLANs 154 Figure 70: Modifying Settings for Static VLANs 154 Figure 71: Showing Static VLANs 154 Figure 72: Configuring Static Members by VLAN Index 157 Figure 73: Configuring Static VLAN Members by Interface 158 Figure 74: Configuring Static VLAN Members by Interface Range 159 Figure 7
Figures Figure 100: Setting the Address Aging Time 188 Figure 101: Displaying the Dynamic MAC Address Table 189 Figure 102: Clearing Entries in the Dynamic MAC Address Table 190 Figure 103: Mirroring Packets Based on the Source MAC Address 191 Figure 104: Showing the Source MAC Addresses to Mirror 191 Figure 105: Issuing MAC Address Traps (Global Configuration) 192 Figure 106: Issuing MAC Address Traps (Interface Configuration) 193 Figure 107: STP Root Ports and Designated Ports 196 Figure
Figures Figure 135: Setting the Queue Mode (WRR) 234 Figure 136: Setting the Queue Mode (Strict and WRR) 235 Figure 137: Mapping CoS Values to Egress Queues 237 Figure 138: Showing CoS Values to Egress Queue Mapping 237 Figure 139: Configuring DSCP to DSCP Internal Mapping 239 Figure 140: Showing DSCP to DSCP Internal Mapping 240 Figure 141: Setting the Trust Mode 241 Figure 142: Configuring CoS to DSCP Internal Mapping 243 Figure 143: Showing CoS to DSCP Internal Mapping 243 Figure 144:
Figures Figure 170: Displaying a Summary of Applied AAA Accounting Methods 282 Figure 171: Displaying Statistics for AAA Accounting Sessions 282 Figure 172: Configuring AAA Authorization Methods 284 Figure 173: Showing AAA Authorization Methods 284 Figure 174: Configuring AAA Authorization Methods for Exec Service 285 Figure 175: Displaying the Applied AAA Authorization Method 285 Figure 176: Configuring User Accounts 287 Figure 177: Showing User Accounts 287 Figure 178: Configuring Global
Figures Figure 205: Configuring a ARP ACL 328 Figure 206: Binding a Port to an ACL 329 Figure 207: Configuring ACL Mirroring 331 Figure 208: Showing the VLANs to Mirror 331 Figure 209: Showing ACL Statistics 332 Figure 210: Configuring Global Settings for ARP Inspection 335 Figure 211: Configuring VLAN Settings for ARP Inspection 337 Figure 212: Configuring Interface Settings for ARP Inspection 338 Figure 213: Displaying Statistics for ARP Inspection 339 Figure 214: Displaying the ARP Ins
Figures Figure 240: Showing the Civic Address for an LLDP Interface 386 Figure 241: Displaying Local Device Information for LLDP (General) 389 Figure 242: Displaying Local Device Information for LLDP (Port) 390 Figure 243: Displaying Local Device Information for LLDP (Port Details) 390 Figure 244: Displaying Remote Device Information for LLDP (Port) 397 Figure 245: Displaying Remote Device Information for LLDP (Port Details) 398 Figure 246: Displaying Remote Device Information for LLDP (End Nod
Figures Figure 275: Configuring an RMON Event 434 Figure 276: Showing Configured RMON Events 435 Figure 277: Configuring an RMON History Sample 436 Figure 278: Showing Configured RMON History Samples 437 Figure 279: Showing Collected RMON History Samples 437 Figure 280: Configuring an RMON Statistical Sample 439 Figure 281: Showing Configured RMON Statistical Samples 439 Figure 282: Showing Collected RMON Statistical Samples 440 Figure 283: Configuring a Switch Cluster 442 Figure 284: Con
Figures Figure 310: Configuring Remote Maintenance End Points 490 Figure 311: Showing Remote Maintenance End Points 490 Figure 312: Transmitting Link Trace Messages 492 Figure 313: Transmitting Loopback Messages 494 Figure 314: Transmitting Delay-Measure Messages 496 Figure 315: Showing Information on Local MEPs 497 Figure 316: Showing Detailed Information on Local MEPs 499 Figure 317: Showing Information on Local MIPs 500 Figure 318: Showing Information on Remote MEPs 501 Figure 319: Sho
Figures Figure 345: Showing IPv6 Statistics (ICMPv6) 546 Figure 346: Showing IPv6 Statistics (UDP) 546 Figure 347: Showing Reported MTU Values 547 Figure 348: Configuring General Settings for DNS 550 Figure 349: Configuring a List of Domain Names for DNS 551 Figure 350: Showing the List of Domain Names for DNS 551 Figure 351: Configuring a List of Name Servers for DNS 552 Figure 352: Showing the List of Name Servers for DNS 553 Figure 353: Configuring Static Entries in the DNS Table 553 F
Figures Figure 380: Showing the IGMP Filtering Profiles Created 593 Figure 381: Adding Multicast Groups to an IGMP Filtering Profile 594 Figure 382: Showing the Groups Assigned to an IGMP Filtering Profile 594 Figure 383: Configuring IGMP Filtering and Throttling Interface Settings 596 Figure 384: Configuring General Settings for MLD Snooping 598 Figure 385: Configuring Immediate Leave for MLD Snooping 599 Figure 386: Configuring a Static Interface for an IPv6 Multicast Router 600 Figure 387:
Figures Figure 415: Showing the Static MVR6 Groups Assigned to a Port 632 Figure 416: Displaying MVR6 Receiver Groups 633 Figure 417: Displaying MVR6 Statistics – Query 635 Figure 418: Displaying MVR6 Statistics – VLAN 636 Figure 419: Displaying MVR6 Statistics – Port 637 – 31 –
Figures – 32 –
Tables Table 1: Key Features 37 Table 2: System Defaults 43 Table 3: Web Page Configuration Buttons 51 Table 4: Switch Main Menu 52 Table 5: Predefined Summer-Time Parameters 90 Table 6: Port Statistics 113 Table 7: LACP Port Counters 135 Table 8: LACP Internal Configuration Information 136 Table 9: LACP Remote Device Configuration Information 138 Table 10: Traffic Segmentation Forwarding 144 Table 11: Recommended STA Path Cost Range 207 Table 12: Default STA Path Costs 208 Table 13
Tables Table 30: Supported Notification Messages 411 Table 31: ERPS Request/State Priority 467 Table 32: Remote MEP Priority Levels 480 Table 33: MEP Defect Descriptions 480 Table 34: OAM Operation State 507 Table 35: Remote Loopback Status 513 Table 36: Address Resolution Protocol 525 Table 37: Show IPv6 Neighbors - display description 540 Table 38: Show IPv6 Statistics - display description 542 Table 39: Show MTU - display description 547 Table 40: Options 60, 66 and 67 Statements 55
Section I Getting Started This section provides an overview of the switch, and introduces some basic concepts about network switches. It also describes the basic settings required to access the management interface.
Section I | Getting Started – 36 –
1 Introduction This switch provides a broad range of features for Layer 2 switching. It includes a management agent that allows you to configure the features listed in this manual. The default configuration can be used for most of the features provided by this switch. However, there are many options that you should configure to maximize the switch’s performance for your particular network environment.
Chapter 1 | Introduction Description of Software Features Table 1: Key Features (Continued) Feature Description Store-and-Forward Switching Supported to ensure wire-speed switching while eliminating bad frames Spanning Tree Algorithm Supports standard STP, Rapid Spanning Tree Protocol (RSTP), and Multiple Spanning Trees (MSTP) Virtual LANs Up to 4093 using IEEE 802.
Chapter 1 | Introduction Description of Software Features a remote authentication server (i.e., RADIUS or TACACS+). Port-based authentication is also supported via the IEEE 802.1X protocol. This protocol uses Extensible Authentication Protocol over LANs (EAPOL) to request user credentials from the 802.1X client, and then uses the EAP between the switch and the authentication server to verify the client’s right to access the network via an authentication server (i.e., RADIUS or TACACS+ server).
Chapter 1 | Introduction Description of Software Features 802.3-2005). The additional ports dramatically increase the throughput across any connection, and provide redundancy by taking over the load if a port in the trunk should fail. The switch supports up to 12 trunks. Storm Control Broadcast, multicast and unknown unicast storm suppression prevents traffic from overwhelming the network.When enabled on a port, the level of traffic passing through the port is restricted.
Chapter 1 | Introduction Description of Software Features ◆ Rapid Spanning Tree Protocol (RSTP, IEEE 802.1w) – This protocol reduces the convergence time for network topology changes to about 3 to 5 seconds, compared to 30 seconds or more for the older IEEE 802.1D STP standard.
Chapter 1 | Introduction Description of Software Features IEEE 802.1Q Tunneling This feature is designed for service providers carrying traffic for multiple customers (QinQ) across their networks. QinQ tunneling is used to maintain customer-specific VLAN and Layer 2 protocol configurations even when different customers use the same internal VLAN IDs.
Chapter 1 | Introduction System Defaults MVR6 for IPv6) which allows common multicast traffic, such as television channels, to be transmitted across a single network-wide multicast VLAN shared by hosts residing in other standard or private VLAN groups, while preserving security and data isolation for normal traffic. Link Layer Discovery LLDP is used to discover basic information about neighboring devices within the Protocol local broadcast domain.
Chapter 1 | Introduction System Defaults Table 2: System Defaults (Continued) Function Parameter Default Authentication and Security Measures (continued) 802.
Chapter 1 | Introduction System Defaults Table 2: System Defaults (Continued) Function Parameter Default ERPS Status Disabled CFM Status Enabled OAM Status Disabled Virtual LANs Default VLAN 1 PVID 1 Acceptable Frame Type All Ingress Filtering Disabled Switchport Mode (Egress Mode) Hybrid GVRP (global) Disabled GVRP (port interface) Disabled QinQ Tunneling Disabled Ingress Port Priority 0 Queue Mode WRR Queue Weight Queue: 0 1 2 3 4 5 6 7 Weight: 1 2 4 6 8 10 12 14 Class
Chapter 1 | Introduction System Defaults Table 2: System Defaults (Continued) Function Parameter Default SNTP Clock Synchronization Disabled Switch Clustering Status Disabled Commander Disabled – 46 –
Section II Web Configuration This section describes the basic switch features, along with a detailed description of how to configure each feature via a web browser.
Section II | Web Configuration – 48 –
2 Using the Web Interface This switch provides an embedded HTTP web agent. Using a web browser you can configure the switch and view statistics to monitor network activity. The web agent can be accessed by any computer on the network using a standard web browser (Internet Explorer 6, Mozilla Firefox 4, or Google Chrome 29, or more recent versions). Note: You can also use the Command Line Interface (CLI) to manage the switch over a serial connection to the console port or via Telnet.
Chapter 2 | Using the Web Interface Navigating the Web Browser Interface commands issued through the web interface. See “Configuring Interface Settings for STA” on page 206. Note: Users are automatically logged off of the HTTP server or HTTPS server if no input is detected for 600 seconds. Note: Connection to the web interface is not supported for HTTPS using an IPv6 link local address. Navigating the Web Browser Interface To access the web-browser interface you must first enter a user name and password.
Chapter 2 | Using the Web Interface Navigating the Web Browser Interface Configuration Options Configurable parameters have a dialog box or a drop-down list. Once a configuration change has been made on a page, be sure to click on the Apply button to confirm the new setting. The following table summarizes the web page configuration buttons. Table 3: Web Page Configuration Buttons Button Action Apply Sets specified values to the system.
Chapter 2 | Using the Web Interface Navigating the Web Browser Interface Main Menu Using the onboard web agent, you can define system parameters, manage and control the switch, and all its ports, or monitor network conditions. The following table briefly describes the selections available from this program.
Chapter 2 | Using the Web Interface Navigating the Web Browser Interface Table 4: Switch Main Menu (Continued) Menu Description Page Interface 101 Port 102 General Configure by Port List Configures connection settings per port 102 Configure by Port Range Configures connection settings for a range of ports 104 Show Information Displays port connection status 105 Mirror 106 Add Sets the source and target ports for mirroring 106 Show Shows the configured mirror sessions 106 Statistics
Chapter 2 | Using the Web Interface Navigating the Web Browser Interface Table 4: Switch Main Menu (Continued) Menu Description Page Show Information 135 Counters Displays statistics for LACP protocol messages Internal Displays configuration settings and operational state for the local side of 136 a link aggregation Neighbors Displays configuration settings and operational state for the remote side 138 of a link aggregation Configure Trunk 135 129 Configure Configures connection settings 12
Chapter 2 | Using the Web Interface Navigating the Web Browser Interface Table 4: Switch Main Menu (Continued) Menu Description Page Show VLAN Shows the VLANs this switch has joined through GVRP 159 Show VLAN Member Shows the interfaces assigned to a VLAN through GVRP 159 IEEE 802.
Chapter 2 | Using the Web Interface Navigating the Web Browser Interface Table 4: Switch Main Menu (Continued) Menu Description Mirror Page Mirrors traffic matching a specified source address from any port on the 190 switch to a target port MAC Notification 191 Configure Global Issues a trap when a dynamic MAC address is added or removed. 191 Configure Interface Enables MAC authentication traps on the current interface.
Chapter 2 | Using the Web Interface Navigating the Web Browser Interface Table 4: Switch Main Menu (Continued) Menu Description Page Default Priority Sets the default priority for each port or trunk 231 Queue Sets queue mode for the switch; sets the service weight for each queue 232 that will use a weighted or hybrid mode Trust Mode Selects DSCP or CoS priority processing Priority DSCP to DSCP 240 238 Configure Maps DSCP values in incoming packets to per-hop behavior and drop precedence value
Chapter 2 | Using the Web Interface Navigating the Web Browser Interface Table 4: Switch Main Menu (Continued) Menu Description Page VoIP Voice over IP 263 Configure Global Configures auto-detection of VoIP traffic, sets the Voice VLAN, and VLAN 263 aging time Configure OUI 265 Add Maps the OUI in the source MAC address of ingress packets to the VoIP 265 device manufacturer Show Shows the OUI telephony list Configure Interface 265 Configures VoIP traffic settings for ports, including the wa
Chapter 2 | Using the Web Interface Navigating the Web Browser Interface Table 4: Switch Main Menu (Continued) Menu Description Page User Accounts 286 Add Configures user names, passwords, and access levels 286 Show Shows authorized users 286 Modify Modifies user attributes 286 Allows authentication and access to the network when 802.
Chapter 2 | Using the Web Interface Navigating the Web Browser Interface Table 4: Switch Main Menu (Continued) Menu Description Page Add Rule 312 Absolute Sets exact time or time range 312 Periodic Sets a recurrent time 312 Shows the time specified by a rule 312 Show Rule Configure ACL 316 Show TCAM Shows utilization parameters for TCAM 315 Add Adds an ACL based on IP or MAC address filtering 316 Show Shows the name and type of configured ACLs 316 Add Rule Configures packet filteri
Chapter 2 | Using the Web Interface Navigating the Web Browser Interface Table 4: Switch Main Menu (Continued) Menu IP Source Guard Port Configuration Description Page Filters IP traffic based on static entries in the IP Source Guard table, or dynamic entries in the DHCP Snooping table 358 Enables IP source guard and selects filter type per port 359 Static Binding 360 Add Adds a static addresses to the source-guard binding table 360 Show Shows static addresses in the source-guard binding table
Chapter 2 | Using the Web Interface Navigating the Web Browser Interface Table 4: Switch Main Menu (Continued) Menu Description Page Configure View 407 Add View Adds an SNMP v3 view of the OID MIB 407 Show View Shows configured SNMP v3 views 407 Add OID Subtree Specifies a part of the subtree for the selected view 407 Show OID Subtree Shows the subtrees assigned to each view 407 Configure Group 409 Add Adds a group with access policies for assigned users 409 Show Shows configured gro
Chapter 2 | Using the Web Interface Navigating the Web Browser Interface Table 4: Switch Main Menu (Continued) Menu Description Page History Periodically samples statistics on a physical interface 435 Statistics Enables collection of statistics on a physical interface 438 History Shows sampling parameters for each entry in the history group 435 Statistics Shows sampling parameters for each entry in the statistics group 438 History Shows sampled data for each entry in the history group 435
Chapter 2 | Using the Web Interface Navigating the Web Browser Interface Table 4: Switch Main Menu (Continued) Menu Configure MA Description Page Configure Maintenance Associations 483 Add Defines a unique CFM service instance, identified by its parent MD, the 483 MA index, the VLAN assigned to the MA, and the MIP creation method Configure Details Configures detailed settings, including continuity check status and 483 interval level, cross-check status, and alarm indication signal parameters Show
Chapter 2 | Using the Web Interface Navigating the Web Browser Interface Table 4: Switch Main Menu (Continued) Menu Remote Loopback UDLD Description Page Performs a loopback test on the specified port 512 UniDirectional Link Detection 515 Configure Global Configures the message probe interval, detection interval, and recovery 515 interval Configure Interface Enables UDLD and aggressive mode which reduces the shut-down delay 515 after loss of bidirectional connectivity is detected Show Informatio
Chapter 2 | Using the Web Interface Navigating the Web Browser Interface Table 4: Switch Main Menu (Continued) Menu Description Page Static Host Table 553 Add Configures static entries for domain name to address mapping 553 Show Shows the list of static mapping entries 553 Modify Modifies the static address mapped to the selected host name 553 Displays cache entries discovered by designated name servers 554 Dynamic Host Configuration Protocol 555 Client Specifies the DHCP client identifi
Chapter 2 | Using the Web Interface Navigating the Web Browser Interface Table 4: Switch Main Menu (Continued) Menu Description Page Interface 579 Configure VLAN Configures IGMP snooping per VLAN interface 579 Show VLAN Information Shows IGMP snooping settings per VLAN interface 579 Forwarding Entry Displays the current multicast groups learned through IGMP Snooping 586 Filter Configure General 591 Enables IGMP filtering for the switch Configure Profile 591 592 Add Adds IGMP filter profil
Chapter 2 | Using the Web Interface Navigating the Web Browser Interface Table 4: Switch Main Menu (Continued) Menu Description Page Multicast VLAN Registration 604 Configure Global Configures proxy switching and robustness value 606 Configure Domain Enables MVR for a domain, sets the MVR VLAN, forwarding priority, and 608 upstream source IP MVR Configure Profile 609 Add Configures multicast stream addresses 609 Show Shows multicast stream addresses 609 Associate Profile 609 Add Maps
Chapter 2 | Using the Web Interface Navigating the Web Browser Interface Table 4: Switch Main Menu (Continued) Menu Description Page Configure Static Group Member 630 Add Statically assigns MVR multicast streams to an interface 630 Show Shows MVR multicast streams assigned to an interface 630 Shows the multicast groups assigned to an MVR VLAN, the source address of the multicast services, and the interfaces with active subscribers 632 Show Member Show Statistics 633 Show Query Statistics S
Chapter 2 | Using the Web Interface Navigating the Web Browser Interface – 70 –
3 Basic Management Tasks This chapter describes the following topics: ◆ Displaying System Information – Provides basic system description, including contact information. ◆ Displaying Hardware/Software Versions – Shows the hardware version, power status, and firmware versions ◆ Configuring Support for Jumbo Frames – Enables support for jumbo frames. ◆ Displaying Bridge Extension Capabilities – Shows the bridge extension parameters.
Chapter 3 | Basic Management Tasks Displaying System Information Displaying System Information Use the System > General page to identify the system by displaying information such as the device name, location and contact information. Parameters These parameters are displayed: ◆ System Description – Brief description of device type. ◆ System Object ID – MIB II object ID for switch’s network management subsystem. ◆ System Up Time – Length of time the management agent has been up.
Chapter 3 | Basic Management Tasks Displaying Hardware/Software Versions Displaying Hardware/Software Versions Use the System > Switch page to display hardware/firmware version numbers for the main board and management software, as well as the power status of the system. Parameters The following parameters are displayed: Main Board Information ◆ Serial Number – The serial number of the switch. ◆ Number of Ports – Number of built-in ports. ◆ Hardware Version – Hardware version of the main board.
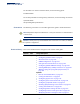
Chapter 3 | Basic Management Tasks Configuring Support for Jumbo Frames Web Interface To view hardware and software version information. 1. Click System, then Switch. Figure 4: General Switch Information Configuring Support for Jumbo Frames Use the System > Capability page to configure support for layer 2 jumbo frames. The switch provides more efficient throughput for large sequential data transfers by supporting jumbo frames up to 10240 bytes for Gigabit Ethernet ports or trunks.
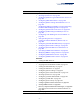
Chapter 3 | Basic Management Tasks Displaying Bridge Extension Capabilities Web Interface To configure support for jumbo frames: 1. Click System, then Capability. 2. Enable or disable support for jumbo frames. 3. Click Apply. Figure 5: Configuring Support for Jumbo Frames Displaying Bridge Extension Capabilities Use the System > Capability page to display settings based on the Bridge MIB.
Chapter 3 | Basic Management Tasks Displaying Bridge Extension Capabilities ◆ Configurable PVID Tagging – This switch allows you to override the default Port VLAN ID (PVID used in frame tags) and egress status (VLAN-Tagged or Untagged) on each port. (Refer to “VLAN Configuration” on page 149.) ◆ Max Supported VLAN Numbers – The maximum number of VLANs supported on this switch. ◆ Max Supported VLAN ID – The maximum configurable VLAN identifier supported on this switch.
Chapter 3 | Basic Management Tasks Managing System Files Managing System Files This section describes how to upgrade the switch operating software or configuration files, and set the system start-up files. Copying Files via FTP/ Use the System > File (Copy) page to upload/download firmware or configuration TFTP or HTTP settings using FTP, TFTP or HTTP. By backing up a file to an FTP/TFTP server or management station, that file can later be downloaded to the switch to restore operation.
Chapter 3 | Basic Management Tasks Managing System Files Note: Up to two copies of the system software (i.e., the runtime firmware) can be stored in the file directory on the switch. Note: The maximum number of user-defined configuration files is limited only by available flash memory space. Note: The file “Factory_Default_Config.cfg” can be copied to a file server or management station, but cannot be used as the destination file name on the switch. Web Interface To copy firmware files: 1.
Chapter 3 | Basic Management Tasks Managing System Files Saving the Running Use the System > File (Copy) page to save the current configuration settings to a Configuration to a local file on the switch. The configuration settings are not automatically saved by Local File the system for subsequent use when the switch is rebooted. You must save these settings to the current startup file, or to another file which can be subsequently set as the startup file.
Chapter 3 | Basic Management Tasks Managing System Files If you replaced a file currently used for startup and want to start using the new file, reboot the system via the System > Reset menu. Setting the Start-up Use the System > File (Set Start-Up) page to specify the firmware or configuration File file to use for system initialization. Web Interface To set a file to use for system initialization: 1. Click System, then File. 2. Select Set Start-Up from the Action list. 3.
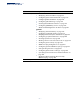
Chapter 3 | Basic Management Tasks Managing System Files 3. To delete a file, mark it in the File List and click Delete. Figure 10: Displaying System Files Automatic Operation Use the System > File (Automatic Operation Code Upgrade) page to automatically Code Upgrade download an operation code file when a file newer than the currently installed one is discovered on the file server.
Chapter 3 | Basic Management Tasks Managing System Files that the file systems of many operating systems such as Unix and most Unixlike systems (FreeBSD, NetBSD, OpenBSD, and most Linux distributions, etc.) are case-sensitive, meaning that two files in the same directory, ecs-runtime.bix and ECS-RUNTIME.BIX are considered to be unique files. Thus, if the upgrade file is stored as ECS-RUNTIME.BIX (or even Ecs-runtime.bix) on a case-sensitive server, then the switch (requesting ecs-runtime.
Chapter 3 | Basic Management Tasks Managing System Files ■ tftp:// – Defines TFTP protocol for the server connection. ■ host – Defines the IP address of the TFTP server. Valid IP addresses consist of four numbers, 0 to 255, separated by periods. DNS host names are not recognized. ■ filedir – Defines the directory, relative to the TFTP server root, where the upgrade file can be found. Nested directory structures are accepted.
Chapter 3 | Basic Management Tasks Managing System Files The following examples demonstrate the URL syntax for an FTP server at IP address 192.168.0.1 with various user name, password and file location options presented: ■ ftp://192.168.0.1/ The user name and password are empty, so “anonymous” will be the user name and the password will be blank. The image file is in the FTP root directory. ■ ftp://switches:upgrade@192.168.0.1/ The user name is “switches” and the password is “upgrade”.
Chapter 3 | Basic Management Tasks Setting the System Clock If a new image is found at the specified location, the following type of messages will be displayed during bootup. . . . Automatic Upgrade is looking for a new image New image detected: current version 1.1.1.0; new version 1.1.1.2 Image upgrade in progress The switch will restart after upgrade succeeds Downloading new image Flash programming started Flash programming completed The switch will now restart . . .
Chapter 3 | Basic Management Tasks Setting the System Clock Web Interface To manually set the system clock: 1. Click System, then Time. 2. Select Configure General from the Step list. 3. Select Manual from the Maintain Type list. 4. Enter the time and date in the appropriate fields. 5.
Chapter 3 | Basic Management Tasks Setting the System Clock 5. Click Apply Figure 13: Setting the Polling Interval for SNTP Specifying SNTP Time Use the System > Time (Configure Time Server) page to specify the IP address for up Servers to three SNTP time servers. Parameters The following parameters are displayed: ◆ SNTP Server IP Address – Sets the IPv4 or IPv6 address for up to three time servers.
Chapter 3 | Basic Management Tasks Setting the System Clock Setting the Time Zone Use the System > Time (Configure Time Zone) page to set the time zone. SNTP uses Coordinated Universal Time (or UTC, formerly Greenwich Mean Time, or GMT) based on the time at the Earth’s prime meridian, zero degrees longitude, which passes through Greenwich, England. To display a time corresponding to your local time, you must indicate the number of hours and minutes your time zone is east (before) or west (after) of UTC.
Chapter 3 | Basic Management Tasks Setting the System Clock Figure 15: Setting the Time Zone Configuring Use the Summer Time page to set the system clock forward during the summer Summer Time months (also known as daylight savings time). In some countries or regions, clocks are adjusted through the summer months so that afternoons have more daylight and mornings have less. This is known as Summer Time, or Daylight Savings Time (DST).
Chapter 3 | Basic Management Tasks Setting the System Clock Table 5: Predefined Summer-Time Parameters Region Start Time, Day, Week, & Month End Time, Day, Week, & Month Australia 00:00:00, Sunday, Week 5 of October 23:59:59, Sunday, Week 5 of March 60 min Europe 00:00:00, Sunday, Week 5 of March 60 min 23:59:59, Sunday, Week 5 of October New Zealand 00:00:00, Sunday, Week 1 of October 23:59:59, Sunday, Week 3 of March USA 02:00:00, Sunday, Week 2 of March Rel.
Chapter 3 | Basic Management Tasks Configuring the Console Port Figure 16: Configuring Summer Time Configuring the Console Port Use the System > Console menu to configure connection parameters for the switch’s console port. You can access the onboard configuration program by attaching a VT100 compatible device to the switch’s serial console port.
Chapter 3 | Basic Management Tasks Configuring the Console Port per character. If no parity is required, specify 8 data bits per character. (Default: 8 bits) ◆ Stop Bits – Sets the number of the stop bits transmitted per byte. (Range: 12; Default: 1 stop bit) ◆ Parity – Defines the generation of a parity bit. Communication protocols provided by some terminals can require a specific parity bit setting. Specify Even, Odd, or None.
Chapter 3 | Basic Management Tasks Configuring Telnet Settings Configuring Telnet Settings Use the System > Telnet menu to configure parameters for accessing the CLI over a Telnet connection. You can access the onboard configuration program over the network using Telnet (i.e., a virtual terminal). Management access via Telnet can be enabled/disabled and other parameters set, including the TCP port number, time outs, and a password. Note that the password is only configurable through the CLI.
Chapter 3 | Basic Management Tasks Displaying CPU Utilization authentication by a single global password as configured for the password command, or by passwords set up for specific user-name accounts. The default is for local passwords configured on the switch. Web Interface To configure parameters for the console port: 1. Click System, then Telnet. 2. Specify the connection parameters as required. 3.
Chapter 3 | Basic Management Tasks Displaying Memory Utilization Figure 19: Displaying CPU Utilization Displaying Memory Utilization Use the System > Memory Status page to display memory utilization parameters. Parameters The following parameters are displayed: ◆ Free Size – The amount of memory currently free for use. ◆ Used Size – The amount of memory allocated to active processes. ◆ Total – The total amount of system memory. Web Interface To display memory utilization: 1.
Chapter 3 | Basic Management Tasks Resetting the System Resetting the System Use the System > Reset menu to restart the switch immediately, at a specified time, after a specified delay, or at a periodic interval. Command Usage ◆ This command resets the entire system. ◆ When the system is restarted, it will always run the Power-On Self-Test. It will also retain all configuration information stored in non-volatile memory. (See “Saving the Running Configuration to a Local File” on page 79).
Chapter 3 | Basic Management Tasks Resetting the System ■ ■ YYYY - The year at which to reload. (Range: 1970-2037) ■ HH - The hour at which to reload. (Range: 00-23) ■ MM - The minute at which to reload. (Range: 00-59) Regularly – Specifies a periodic interval at which to reload the switch. Time ■ HH - The hour at which to reload. (Range: 00-23) ■ MM - The minute at which to reload. (Range: 00-59) Period ■ Daily - Every day. ■ Weekly - Day of the week at which to reload. (Range: Sunday ...
Chapter 3 | Basic Management Tasks Resetting the System Figure 21: Restarting the Switch (Immediately) Figure 22: Restarting the Switch (In) – 98 –
Chapter 3 | Basic Management Tasks Resetting the System Figure 23: Restarting the Switch (At) Figure 24: Restarting the Switch (Regularly) – 99 –
Chapter 3 | Basic Management Tasks Resetting the System – 100 –
4 Interface Configuration This chapter describes the following topics: ◆ Port Configuration – Configures connection settings, including autonegotiation, or manual setting of speed, duplex mode, and flow control. ◆ Local Port Mirroring – Sets the source and target ports for mirroring on the local switch. ◆ Remote Port Mirroring – Configures mirroring of traffic from remote switches for analysis at a destination port on the local switch.
Chapter 4 | Interface Configuration Port Configuration Port Configuration This section describes how to configure port connections, mirror traffic from one port to another, and run cable diagnostics. Configuring by Port Use the Interface > Port > General (Configure by Port List) page to enable/disable List an interface, set auto-negotiation and the interface capabilities to advertise, or manually fix the speed, duplex mode, and flow control.
Chapter 4 | Interface Configuration Port Configuration ◆ ■ SFP-Forced-1000SFP - Always uses the SFP port (even if a module is not installed), and configured for a 1000BASE SFP transceiver. The speed is set by autonegotiation, and the mode is fixed at Full Duplex ■ SFP-Forced-100FX - Always uses the SFP port (even if a module is not installed), and configured for a 100BASE-FX transceiver. The speed is set by autonegotiation, and the mode is fixed at Full Duplex.
Chapter 4 | Interface Configuration Port Configuration Web Interface To configure port connection parameters: 1. Click Interface, Port, General. 2. Select Configure by Port List from the Action List. 3. Modify the required interface settings. 4. Click Apply.
Chapter 4 | Interface Configuration Port Configuration 5. Click Apply. Figure 26: Configuring Connections by Port Range Displaying Use the Interface > Port > General (Show Information) page to display the current Connection Status connection status, including link state, speed/duplex mode, flow control, and autonegotiation. Parameters These parameters are displayed: ◆ Port – Port identifier. ◆ Type – Indicates the port type. (1000BASE-T, 100BASE SFP, 1000BASE SFP) ◆ Name – Interface label.
Chapter 4 | Interface Configuration Port Configuration Figure 27: Displaying Port Information Configuring Local Port Use the Interface > Port > Mirror page to mirror traffic from any source port to a Mirroring target port for real-time analysis. You can then attach a logic analyzer or RMON probe to the target port and study the traffic crossing the source port in a completely unobtrusive manner.
Chapter 4 | Interface Configuration Port Configuration ◆ Note that Spanning Tree BPDU packets are not mirrored to the target port. Parameters These parameters are displayed: ◆ Source Port – The port whose traffic will be monitored. ◆ Target Port – The port that will mirror the traffic on the source port. ◆ Type – Allows you to select which traffic to mirror to the target port, Rx (receive), Tx (transmit), or Both. (Default: Both) Web Interface To configure a local mirror session: 1.
Chapter 4 | Interface Configuration Port Configuration To display the configured mirror sessions: 1. Click Interface, Port, Mirror. 2. Select Show from the Action List. Figure 30: Displaying Local Port Mirror Sessions Configuring Use the Interface > Port > RSPAN page to mirror traffic from remote switches for Remote Port Mirroring analysis at a destination port on the local switch.
Chapter 4 | Interface Configuration Port Configuration to a destination port on this switch (remote port mirroring as described in this section). ◆ Configuration Guidelines Take the following step to configure an RSPAN session: 1. Use the VLAN Static List (see “Configuring VLAN Groups” on page 152) to reserve a VLAN for use by RSPAN (marking the “Remote VLAN” field on this page. (Default VLAN 1 is prohibited.) 2.
Chapter 4 | Interface Configuration Port Configuration ■ IEEE 802.1X – RSPAN and 802.1X are mutually exclusive functions. When 802.1X is enabled globally, RSPAN uplink ports cannot be configured, even though RSPAN source and destination ports can still be configured. When RSPAN uplink ports are enabled on the switch, 802.1X cannot be enabled globally.
Chapter 4 | Interface Configuration Port Configuration ◆ Type – Specifies the traffic type to be mirrored remotely. (Options: Rx, Tx, Both) ◆ Destination Port – Specifies the destination port1 to monitor the traffic mirrored from the source ports. Only one destination port can be configured on the same switch per session, but a destination port can be configured on more than one switch for the same session.
Chapter 4 | Interface Configuration Port Configuration Figure 33: Configuring Remote Port Mirroring (Intermediate) Figure 34: Configuring Remote Port Mirroring (Destination) Showing Port or Trunk Use the Interface > Port/Trunk > Statistics or Chart page to display standard Statistics statistics on network traffic from the Interfaces Group and Ethernet-like MIBs, as well as a detailed breakdown of traffic based on the RMON MIB.
Chapter 4 | Interface Configuration Port Configuration Parameters These parameters are displayed: Table 6: Port Statistics Parameter Description Interface Statistics Received Octets The total number of octets received on the interface, including framing characters. Transmitted Octets The total number of octets transmitted out of the interface, including framing characters.
Chapter 4 | Interface Configuration Port Configuration Table 6: Port Statistics (Continued) Parameter Description Deferred Transmissions A count of frames for which the first transmission attempt on a particular interface is delayed because the medium was busy. Frames Too Long A count of frames received on a particular interface that exceed the maximum permitted frame size. Alignment Errors The number of alignment errors (missynchronized data packets).
Chapter 4 | Interface Configuration Port Configuration Table 6: Port Statistics (Continued) Parameter Description 65-127 Byte Packets 128-255 Byte Packets 256-511 Byte Packets 512-1023 Byte Packets 1024-1518 Byte Packets 1519-1536 Byte Packets The total number of packets (including bad packets) received and transmitted where the number of octets fall within the specified range (excluding framing bits but including FCS octets).
Chapter 4 | Interface Configuration Port Configuration To show a chart of port statistics: 1. Click Interface, Port, Chart. 2. Select the statistics mode to display (Interface, Etherlike, RMON or All). 3. If Interface, Etherlike, RMON statistics mode is chosen, select a port from the drop-down list. If All (ports) statistics mode is chosen, select the statistics type to display.
Chapter 4 | Interface Configuration Port Configuration ◆ To configure statistical history sampling, use the "history" on page 955 Parameters These parameters are displayed: Add ◆ Port – Port number. (Range: 1-12) ◆ History Name – Name of sample interval. (Range: 1-32 characters) ◆ Interval - The interval for sampling statistics. (Range: 1-86400 minutes) ◆ Requested Buckets - The number of samples to take. (Range: 1-96) Show ◆ Port – Port number.
Chapter 4 | Interface Configuration Port Configuration 4. Enter the sample name, the interval, and the number of buckets requested. 5. Click Apply. Figure 37: Configuring a History Sample To show the configured entries for a history sample: 1. Click Interface, Port, Statistics, or Interface, Trunk, Statistics. 2. Select Show from the Action menu. 3. Select an interface from the Port or Trunk list. Figure 38: Showing Entries for History Sampling To show the configured parameters for a sampling entry: 1.
Chapter 4 | Interface Configuration Port Configuration Figure 39: Showing Status of Statistical History Sample To show statistics for the current interval of a sample entry: 1. Click Interface, Port, Statistics, or Interface, Trunk, Statistics. 2. Select Show Details from the Action menu. 3. Select Current Entry from the options for Mode. 4. Select an interface from the Port or Trunk list. 5. Select an sampling entry from the Name list.
Chapter 4 | Interface Configuration Port Configuration To show ingress or egress traffic statistics for a sample entry: 1. Click Interface, Port, Statistics, or Interface, Trunk, Statistics. 2. Select Show Details from the Action menu. 3. Select Input Previous Entry or Output Previous Entry from the options for Mode. 4. Select an interface from the Port or Trunk list. 5. Select an sampling entry from the Name list.
Chapter 4 | Interface Configuration Port Configuration problems with optical devices. This feature, referred to as Digital Diagnostic Monitoring (DDM) provides information on transceiver parameters. Web Interface To display identifying information and functional parameters for optical transceivers: 1. Click Interface, Port, Transceiver. 2. Select a port from the scroll-down list.
Chapter 4 | Interface Configuration Port Configuration The switch can display diagnostic information for SFP modules which support the SFF-8472 Specification for Diagnostic Monitoring Interface for Optical Transceivers. This information allows administrators to remotely diagnose problems with optical devices. This feature, referred to as Digital Diagnostic Monitoring (DDM) provides information on transceiver parameters.
Chapter 4 | Interface Configuration Port Configuration ■ Trap messages configured by this command are sent to any management station configured as an SNMP trap manager using the Administration > SNMP (Configure Trap) page. Note: Trap messages for transceiver thresholds are disabled by default. To send a trap when any of the transceiver’s operational values fall outside of specified thresholds, use the transceiver-monitor command in the CLI.
Chapter 4 | Interface Configuration Port Configuration ◆ This cable test is only accurate for cables 7 - 100 meters long. ◆ The test takes approximately 5 seconds. The switch displays the results of the test immediately upon completion, including common cable failures, as well as the status and approximate length to a fault.
Chapter 4 | Interface Configuration Trunk Configuration Figure 44: Performing Cable Tests Trunk Configuration This section describes how to configure static and dynamic trunks. You can create multiple links between devices that work as one virtual, aggregate link. A port trunk offers a dramatic increase in bandwidth for network segments where bottlenecks exist, as well as providing a fault-tolerant link between two devices. You can create up to 6 trunks at a time on the switch.
Chapter 4 | Interface Configuration Trunk Configuration Command Usage Besides balancing the load across each port in the trunk, the other ports provide redundancy by taking over the load if a port in the trunk fails. However, before making any physical connections between devices, use the web interface or CLI to specify the trunk on the devices at both ends.
Chapter 4 | Interface Configuration Trunk Configuration Command Usage ◆ When configuring static trunks, you may not be able to link switches of different types, depending on the vendor’s implementation. However, note that the static trunks on this switch are Cisco EtherChannel compatible.
Chapter 4 | Interface Configuration Trunk Configuration To add member ports to a static trunk: 1. Click Interface, Trunk, Static. 2. Select Configure Trunk from the Step list. 3. Select Add Member from the Action list. 4. Select a trunk identifier. 5. Set the unit and port for an additional trunk member. 6. Click Apply. Figure 47: Adding Static Trunks Members To configure connection parameters for a static trunk: 1. Click Interface, Trunk, Static. 2. Select Configure General from the Step list. 3.
Chapter 4 | Interface Configuration Trunk Configuration To display trunk connection parameters: 1. Click Interface, Trunk, Static. 2. Select Configure General from the Step list. 3. Select Show Information from the Action list.
Chapter 4 | Interface Configuration Trunk Configuration ◆ Ports are only allowed to join the same Link Aggregation Group (LAG) if (1) the LACP port system priority matches, (2) the LACP port admin key matches, and (3) the LAG admin key matches (if configured). However, if the LAG admin key is set, then the port admin key must be set to the same value for a port to be allowed to join that group. Note: If the LACP admin key is not set when a channel group is formed (i.e.
Chapter 4 | Interface Configuration Trunk Configuration When a dynamic port-channel is torn down, the configured timeout value will be retained. When the dynamic port-channel is constructed again, that timeout value will be used. Configure Aggregation Port - General ◆ Port – Port identifier. (Range: 1-12) ◆ LACP Status – Enables or disables LACP on a port. Configure Aggregation Port - Actor/Partner ◆ Port – Port number.
Chapter 4 | Interface Configuration Trunk Configuration Note: Configuring LACP settings for a port only applies to its administrative state, not its operational state, and will only take effect the next time an aggregate link is established with that port. Note: Configuring the port partner sets the remote side of an aggregate link; i.e., the ports on the attached device. The command attributes have the same meaning as those used for the port actor.
Chapter 4 | Interface Configuration Trunk Configuration Figure 52: Enabling LACP on a Port To configure LACP parameters for group members: 1. Click Interface, Trunk, Dynamic. 2. Select Configure Aggregation Port from the Step list. 3. Select Configure from the Action list. 4. Click Actor or Partner. 5. Configure the required settings. 6. Click Apply.
Chapter 4 | Interface Configuration Trunk Configuration To show the active members of a dynamic trunk: 1. Click Interface, Trunk, Dynamic. 2. Select Configure Trunk from the Step list. 3. Select Show Member from the Action list. 4. Select a Trunk. Figure 54: Showing Members of a Dynamic Trunk To configure connection parameters for a dynamic trunk: 1. Click Interface, Trunk, Dynamic. 2. Select Configure Trunk from the Step list. 3. Select Configure from the Action list. 4.
Chapter 4 | Interface Configuration Trunk Configuration 2. Select Configure Trunk from the Step list. 3. Select Show from the Action list. Figure 56: Showing Connection Parameters for Dynamic Trunks Displaying LACP Port Use the Interface > Trunk > Dynamic (Configure Aggregation Port - Show Counters Information - Counters) page to display statistics for LACP protocol messages.
Chapter 4 | Interface Configuration Trunk Configuration Figure 57: Displaying LACP Port Counters Displaying LACP Use the Interface > Trunk > Dynamic (Configure Aggregation Port - Show Settings and Status for Information - Internal) page to display the configuration settings and operational the Local Side state for the local side of a link aggregation.
Chapter 4 | Interface Configuration Trunk Configuration Table 8: LACP Internal Configuration Information (Continued) Parameter Description Admin State, Oper State (continued) ◆ ◆ ◆ Aggregation – The system considers this link to be aggregatable; i.e., a potential candidate for aggregation. Long timeout – Periodic transmission of LACPDUs uses a slow transmission rate. LACP-Activity – Activity control value with regard to this link.
Chapter 4 | Interface Configuration Trunk Configuration Displaying LACP Use the Interface > Trunk > Dynamic (Configure Aggregation Port - Show Settings and Status for Information - Neighbors) page to display the configuration settings and the Remote Side operational state for the remote side of a link aggregation. Parameters These parameters are displayed: Table 9: LACP Remote Device Configuration Information Parameter Description Partner Admin System LAG partner’s system ID assigned by the user.
Chapter 4 | Interface Configuration Trunk Configuration Figure 59: Displaying LACP Port Remote Information Configuring Use the Interface > Trunk > Load Balance page to set the load-distribution method Load Balancing used among ports in aggregated links. Command Usage ◆ This command applies to all static and dynamic trunks on the switch.
Chapter 4 | Interface Configuration Trunk Configuration ■ Source and Destination MAC Address: All traffic with the same source and destination MAC address is output on the same link in a trunk. This mode works best for switch-to-switch trunk links where traffic through the switch is received from and destined for many different hosts. ■ Source IP Address: All traffic with the same source IP address is output on the same link in a trunk.
Chapter 4 | Interface Configuration Saving Power Saving Power Use the Interface > Green Ethernet page to enable power savings mode on the selected port. Command Usage ◆ IEEE 802.3 defines the Ethernet standard and subsequent power requirements based on cable connections operating at 100 meters. Enabling power saving mode can reduce power used for cable lengths of 60 meters or less, with more significant reduction for cables of 20 meters or less, and continue to ensure signal integrity.
Chapter 4 | Interface Configuration Saving Power ◆ Power Saving Status – Adjusts the power provided to ports based on the length of the cable used to connect to other devices. Only sufficient power is used to maintain connection requirements. (Default: Enabled on Gigabit Ethernet RJ-45 ports) Web Interface To enable power savings: 1. Click Interface, Green Ethernet. 2. Mark the Enabled check box for a port. 3. Click Apply.
Chapter 4 | Interface Configuration Traffic Segmentation Traffic Segmentation If tighter security is required for passing traffic from different clients through downlink ports on the local network and over uplink ports to the service provider, port-based traffic segmentation can be used to isolate traffic for individual clients. Data traffic on downlink ports is only forwarded to, and from, uplink ports. Traffic belonging to each client is isolated to the allocated downlink ports.
Chapter 4 | Interface Configuration Traffic Segmentation Figure 62: Enabling Traffic Segmentation Configuring Uplink Use the Interface > Traffic Segmentation (Configure Session) page to assign the and Downlink Ports downlink and uplink ports to use in the segmented group. Ports designated as downlink ports can not communicate with any other ports on the switch except for the uplink ports. Uplink ports can communicate with any other ports on the switch and with any designated downlink ports.
Chapter 4 | Interface Configuration Traffic Segmentation ◆ If a downlink port is not configured for the session, the assigned uplink ports will operate as normal ports. Parameters These parameters are displayed: ◆ Session ID – Traffic segmentation session. (Range: 1-4) ◆ Direction – Adds an interface to the segmented group by setting the direction to uplink or downlink. (Default: Uplink) ◆ Interface – Displays a list of ports or trunks. ■ Port – Port Identifier.
Chapter 4 | Interface Configuration VLAN Trunking To show the members of the traffic segmentation group: 1. Click Interface, Traffic Segmentation. 2. Select Configure Session from the Step list. 3. Select Show from the Action list. Figure 64: Showing Traffic Segmentation Members VLAN Trunking Use the Interface > VLAN Trunking page to allow unknown VLAN groups to pass through the specified interface.
Chapter 4 | Interface Configuration VLAN Trunking and E automatically allow frames with VLAN group tags 1 and 2 (groups that are unknown to those switches) to pass through their VLAN trunking ports. ◆ VLAN trunking is mutually exclusive with the “access” switchport mode (see “Adding Static Members to VLANs” on page 155). If VLAN trunking is enabled on an interface, then that interface cannot be set to access mode, and vice versa.
Chapter 4 | Interface Configuration VLAN Trunking Figure 66: Configuring VLAN Trunking – 148 –
5 VLAN Configuration This chapter includes the following topics: ◆ IEEE 802.1Q VLANs – Configures static and dynamic VLANs. ◆ IEEE 802.1Q Tunneling – Configures QinQ tunneling to maintain customerspecific VLAN and Layer 2 protocol configurations across a service provider network, even when different customers use the same internal VLAN IDs. ◆ Protocol VLANs2 – Configures VLAN groups based on specified protocols.
Chapter 5 | VLAN Configuration IEEE 802.1Q VLANs groups (such as e-mail), or multicast groups (used for multimedia applications such as video conferencing). VLANs provide greater network efficiency by reducing broadcast traffic, and allow you to make network changes without having to update IP addresses or IP subnets. VLANs inherently provide a high level of network security since traffic must pass through a configured Layer 3 link to reach a different VLAN.
Chapter 5 | VLAN Configuration IEEE 802.1Q VLANs Figure 67: VLAN Compliant and VLAN Non-compliant Devices tagged frames VA VA VA: VLAN Aware VU: VLAN Unaware tagged frames VA untagged frames VA VU VLAN Classification – When the switch receives a frame, it classifies the frame in one of two ways. If the frame is untagged, the switch assigns the frame to an associated VLAN (based on the default VLAN ID of the receiving port).
Chapter 5 | VLAN Configuration IEEE 802.1Q VLANs disable GVRP on the boundary ports to prevent advertisements from being propagated, or forbid those ports from joining restricted VLANs. Note: If you have host devices that do not support GVRP, you should configure static or untagged VLANs for the switch ports connected to these devices (as described in “Adding Static Members to VLANs” on page 155). But you can still enable GVRP on these edge switches, as well as on the core switches in the network.
Chapter 5 | VLAN Configuration IEEE 802.1Q VLANs Parameters These parameters are displayed: Add ◆ VLAN ID – ID of VLAN or range of VLANs (1-4094). VLAN 1 is the default untagged VLAN. VLAN 4093 is dedicated for Switch Clustering. Configuring this VLAN for other purposes may cause problems in the Clustering operation. ◆ Status – Enables or disables the specified VLAN. ◆ Remote VLAN – Reserves this VLAN for RSPAN (see “Configuring Remote Port Mirroring” on page 108).
Chapter 5 | VLAN Configuration IEEE 802.1Q VLANs Figure 69: Creating Static VLANs To modify the configuration settings for VLAN groups: 1. Click VLAN, Static. 2. Select Modify from the Action list. 3. Select the identifier of a configured VLAN. 4. Modify the VLAN name or operational status as required. 5. Click Apply. Figure 70: Modifying Settings for Static VLANs To show the configuration settings for VLAN groups: 1. Click VLAN, Static. 2. Select Show from the Action list.
Chapter 5 | VLAN Configuration IEEE 802.1Q VLANs Adding Static Use the VLAN > Static (Edit Member by VLAN, Edit Member by Interface, or Edit Members to VLANs Member by Interface Range) pages to configure port members for the selected VLAN index, interface, or a range of interfaces.
Chapter 5 | VLAN Configuration IEEE 802.1Q VLANs receive all frame types, any received frames that are untagged are assigned to the default VLAN. (Options: All, Tagged; Default: All) ◆ ◆ Ingress Filtering – Determines how to process frames tagged for VLANs for which the ingress port is not a member. (Default: Disabled) ■ Ingress filtering only affects tagged frames.
Chapter 5 | VLAN Configuration IEEE 802.1Q VLANs ◆ Port Range – Displays a list of ports. (Range: 1-12) ◆ Trunk Range – Displays a list of ports. (Range: 1-12) Note: The PVID, acceptable frame type, and ingress filtering parameters for each interface within the specified range must be configured on either the Edit Member by VLAN or Edit Member by Interface page. Web Interface To configure static members by the VLAN index: 1. Click VLAN, Static. 2. Select a VLAN from the scroll-down list. 3.
Chapter 5 | VLAN Configuration IEEE 802.1Q VLANs 5. Modify the settings for any interface as required. 6. Click Apply. Figure 73: Configuring Static VLAN Members by Interface To configure static members by interface range: 1. Click VLAN, Static. 2. Select Edit Member by Interface Range from the Action list. 3. Set the Interface type to display as Port or Trunk. 4. Enter an interface range. 5. Modify the VLAN parameters as required.
Chapter 5 | VLAN Configuration IEEE 802.1Q VLANs Figure 74: Configuring Static VLAN Members by Interface Range Configuring Dynamic Use the VLAN > Dynamic page to enable GVRP globally on the switch, or to enable VLAN Registration GVRP and adjust the protocol timers per interface. Parameters These parameters are displayed: Configure General ◆ GVRP Status – GVRP defines a way for switches to exchange VLAN information in order to register VLAN members on ports across the network.
Chapter 5 | VLAN Configuration IEEE 802.1Q VLANs ■ Join – The interval between transmitting requests/queries to participate in a VLAN group. (Range: 20-1000 centiseconds; Default: 20 centiseconds) ■ Leave – The interval a port waits before leaving a VLAN group. This time should be set to more than twice the join time. This ensures that after a Leave or LeaveAll message has been issued, the applicants can rejoin before the port actually leaves the group.
Chapter 5 | VLAN Configuration IEEE 802.1Q VLANs Figure 75: Configuring Global Status of GVRP To configure GVRP status and timers on a port or trunk: 1. Click VLAN, Dynamic. 2. Select Configure Interface from the Step list. 3. Set the Interface type to display as Port or Trunk. 4. Modify the GVRP status or timers for any interface. 5. Click Apply. Figure 76: Configuring GVRP for an Interface To show the dynamic VLAN joined by this switch: 1. Click VLAN, Dynamic. 2.
Chapter 5 | VLAN Configuration IEEE 802.1Q VLANs Figure 77: Showing Dynamic VLANs Registered on the Switch To show the members of a dynamic VLAN: 1. Click VLAN, Dynamic. 2. Select Show Dynamic VLAN from the Step list. 3. Select Show VLAN Members from the Action list. Figure 78: Showing the Members of a Dynamic VLAN Showing VLAN Use the VLAN > Statistics page to display statistics on network traffic from the Statistics Interfaces Group. These statistics display the number of octets and packets received.
Chapter 5 | VLAN Configuration IEEE 802.1Q Tunneling Web Interface To show interface statistics for a VLAN: 1. Click VLAN, Statistics. 2. Select a VLAN from the drop-down list. Figure 79: Showing VLAN Statistics IEEE 802.1Q Tunneling IEEE 802.1Q Tunneling (QinQ) is designed for service providers carrying traffic for multiple customers across their networks.
Chapter 5 | VLAN Configuration IEEE 802.1Q Tunneling SPVLANs to carry inbound traffic for different customers onto the service provider’s network. When a double-tagged packet enters another trunk port in an intermediate or core switch in the service provider’s network, the outer tag is stripped for packet processing. When the packet exits another trunk port on the same core switch, the same SPVLAN tag is again added to the packet.
Chapter 5 | VLAN Configuration IEEE 802.1Q Tunneling (8100 0000). If the incoming packet is tagged, the outer tag is an SPVLAN tag, and the inner tag is a CVLAN tag. 3. After packet classification through the switching process, the packet is written to memory with one tag (an outer tag) or with two tags (both an outer tag and inner tag). 4. The switch sends the packet to the proper egress port. 5. If the egress port is an untagged member of the SPVLAN, the outer tag will be stripped.
Chapter 5 | VLAN Configuration IEEE 802.1Q Tunneling 5. If the destination address lookup fails, the packet is sent to all member ports of the outer tag's VLAN. 6. After packet classification, the packet is written to memory for processing as a single-tagged or double-tagged packet. 7. The switch sends the packet to the proper egress port. 8. If the egress port is an untagged member of the SPVLAN, the outer tag will be stripped. If it is a tagged member, the outgoing packet will have two tags.
Chapter 5 | VLAN Configuration IEEE 802.1Q Tunneling 4. Configure the QinQ tunnel access port to join the SPVLAN as an untagged member (see “Adding Static Members to VLANs” on page 155). 5. Configure the SPVLAN ID as the native VID on the QinQ tunnel access port (see “Adding Static Members to VLANs” on page 155). 6. Configure the QinQ tunnel uplink port to Uplink mode (see “Adding an Interface to a QinQ Tunnel” on page 170). 7.
Chapter 5 | VLAN Configuration IEEE 802.1Q Tunneling Web Interface To enable QinQ Tunneling on the switch: 1. Click VLAN, Tunnel. 2. Select Configure Global from the Step list. 3. Enable Tunnel Status, and specify the TPID if a client attached to a tunnel port is using a non-standard ethertype to identify 802.1Q tagged frames. 4. Click Apply. Figure 81: Enabling QinQ Tunneling Creating Use the VLAN > Tunnel (Configure Service) page to create a CVLAN to SPVLAN CVLAN to SPVLAN mapping entry.
Chapter 5 | VLAN Configuration IEEE 802.1Q Tunneling Parameters These parameters are displayed: ◆ Port – Port identifier. (Range: 1-12) ◆ Customer VLAN ID – VLAN ID for the inner VLAN tag. (Range: 1-4094) ◆ Service VLAN ID – VLAN ID for the outer VLAN tag. (Range: 1-4094) Web Interface To configure a mapping entry: 1. Click VLAN, Tunnel. 2. Select Configure Service from the Step list. 3. Select Add from the Action list. 4. Select an interface from the Port list. 5.
Chapter 5 | VLAN Configuration IEEE 802.1Q Tunneling Figure 83: Showing CVLAN to SPVLAN Mapping Entries The preceding example sets the SVID to 99 in the outer tag for egress packets exiting port 1 when the packet’s CVID is 2. For a more detailed example, see the “switchport dot1q-tunnel service match cvid” command in the CLI Reference Guide. Adding an Interface to Follow the guidelines in the preceding section to set up a QinQ tunnel on the a QinQ Tunnel switch.
Chapter 5 | VLAN Configuration Protocol VLANs Web Interface To add an interface to a QinQ tunnel: 1. Click VLAN, Tunnel. 2. Select Configure Interface from the Step list. 3. Set the mode for any tunnel access port to Access and the tunnel uplink port to Uplink. 4. Click Apply. Figure 84: Adding an Interface to a QinQ Tunnel Protocol VLANs The network devices required to support multiple protocols cannot be easily grouped into a common VLAN.
Chapter 5 | VLAN Configuration Protocol VLANs 2. Create a protocol group for each of the protocols you want to assign to a VLAN using the Configure Protocol (Add) page. 3. Then map the protocol for each interface to the appropriate VLAN using the Configure Interface (Add) page. ◆ When MAC-based, IP subnet-based, or protocol-based VLANs are supported concurrently, priority is applied in this sequence, and then port-based VLANs last.
Chapter 5 | VLAN Configuration Protocol VLANs Web Interface To configure a protocol group: 1. Click VLAN, Protocol. 2. Select Configure Protocol from the Step list. 3. Select Add from the Action list. 4. Select an entry from the Frame Type list. 5. Select an entry from the Protocol Type list. 6. Enter an identifier for the protocol group. 7. Click Apply. Figure 85: Configuring Protocol VLANs To configure a protocol group: 1. Click VLAN, Protocol. 2. Select Configure Protocol from the Step list. 3.
Chapter 5 | VLAN Configuration Protocol VLANs Figure 86: Displaying Protocol VLANs Mapping Use the VLAN > Protocol (Configure Interface - Add) page to map a protocol group Protocol Groups to to a VLAN for each interface that will participate in the group. Interfaces Command Usage ◆ When creating a protocol-based VLAN, only assign interfaces using this configuration screen.
Chapter 5 | VLAN Configuration Protocol VLANs ◆ VLAN ID – VLAN to which matching protocol traffic is forwarded. (Range: 1-4094) ◆ Priority – The priority assigned to untagged ingress traffic. (Range: 0-7, where 7 is the highest priority) Web Interface To map a protocol group to a VLAN for a port or trunk: 1. Click VLAN, Protocol. 2. Select Configure Interface from the Step list. 3. Select Add from the Action list. 4. Select a port or trunk. 5. Enter the identifier for a protocol group. 6.
Chapter 5 | VLAN Configuration Configuring IP Subnet VLANs Figure 88: Showing the Interface to Protocol Group Mapping Configuring IP Subnet VLANs Use the VLAN > IP Subnet page to configure IP subnet-based VLANs. When using port-based classification, all untagged frames received by a port are classified as belonging to the VLAN whose VID (PVID) is associated with that port.
Chapter 5 | VLAN Configuration Configuring IP Subnet VLANs ◆ VLAN – VLAN to which matching IP subnet traffic is forwarded. (Range: 1-4094) ◆ Priority – The priority assigned to untagged ingress traffic. (Range: 0-7, where 7 is the highest priority; Default: 0) Web Interface To map an IP subnet to a VLAN: 1. Click VLAN, IP Subnet. 2. Select Add from the Action list. 3. Enter an address in the IP Address field. 4. Enter a mask in the Subnet Mask field. 5. Enter the identifier in the VLAN field.
Chapter 5 | VLAN Configuration Configuring MAC-based VLANs Figure 90: Showing IP Subnet VLANs Configuring MAC-based VLANs Use the VLAN > MAC-Based page to configure VLAN based on MAC addresses. The MAC-based VLAN feature assigns VLAN IDs to ingress untagged frames according to source MAC addresses. When MAC-based VLAN classification is enabled, untagged frames received by a port are assigned to the VLAN which is mapped to the frame’s source MAC address.
Chapter 5 | VLAN Configuration Configuring MAC-based VLANs So the mask in hexadecimal for this example could be: ff-fx-xx-xx-xx-xx/ff-c0-00-00-00-00/ff-e0-00-00-00-00 ◆ VLAN – VLAN to which ingress traffic matching the specified source MAC address is forwarded. (Range: 1-4094) ◆ Priority – The priority assigned to untagged ingress traffic. (Range: 0-7, where 7 is the highest priority; Default: 0) Web Interface To map a MAC address to a VLAN: 1. Click VLAN, MAC-Based. 2.
Chapter 5 | VLAN Configuration Configuring VLAN Mirroring Figure 92: Showing MAC-Based VLANs Configuring VLAN Mirroring Use the VLAN > Mirror (Add) page to mirror traffic from one or more source VLANs to a target port for real-time analysis. You can then attach a logic analyzer or RMON probe to the target port and study the traffic crossing the source VLAN(s) in a completely unobtrusive manner. Command Usage ◆ All active ports in a source VLAN are monitored for ingress traffic only.
Chapter 5 | VLAN Configuration Configuring VLAN Mirroring ◆ Target Port – The destination port that receives the mirrored traffic from the source VLAN. (Range: 1-12) Web Interface To configure VLAN mirroring: 1. Click VLAN, Mirror. 2. Select Add from the Action list. 3. Select the source VLAN, and select a target port. 4. Click Apply. Figure 93: Configuring VLAN Mirroring To show the VLANs to be mirrored: 1. Click VLAN, Mirror. 2. Select Show from the Action list.
Chapter 5 | VLAN Configuration Configuring VLAN Translation Configuring VLAN Translation Use the VLAN > Translation (Add) page to map VLAN IDs between the customer and service provider for networks that do not support IEEE 802.1Q tunneling. Command Usage ◆ QinQ tunneling uses double tagging to preserve the customer’s VLAN tags on traffic crossing the service provider’s network.
Chapter 5 | VLAN Configuration Configuring VLAN Translation Web Interface To configure VLAN translation: 1. Click VLAN, Translation. 2. Select Add from the Action list. 3. Select a port, and enter the original and new VLAN IDs. 4. Click Apply. Figure 96: Configuring VLAN Translation To show the mapping entries for VLANs translation: 1. Click VLAN, Translation. 2. Select Show from the Action list. 3. Select a port.
Chapter 5 | VLAN Configuration Configuring VLAN Translation – 184 –
6 Address Table Settings Switches store the addresses for all known devices. This information is used to pass traffic directly between the inbound and outbound ports. All the addresses learned by monitoring traffic are stored in the dynamic address table. You can also manually configure static addresses that are bound to a specific port. This chapter describes the following topics: ◆ Static MAC Addresses – Configures static entries in the address table.
Chapter 6 | Address Table Settings Setting Static Addresses Parameters These parameters are displayed: Add Static Address ◆ VLAN – ID of configured VLAN. (Range: 1-4094) ◆ Interface – Port or trunk associated with the device assigned a static address. ◆ MAC Address – Physical address of a device mapped to this interface. Enter an address in the form of xx-xx-xx-xx-xx-xx or xxxxxxxxxxxx. ◆ Static Status – Sets the time to retain the specified address.
Chapter 6 | Address Table Settings Changing the Aging Time Figure 98: Configuring Static MAC Addresses To show the static addresses in MAC address table: 1. Click MAC Address, Static. 2. Select Show from the Action list. Figure 99: Displaying Static MAC Addresses Changing the Aging Time Use the MAC Address > Dynamic (Configure Aging) page to set the aging time for entries in the dynamic address table. The aging time is used to age out dynamically learned forwarding information.
Chapter 6 | Address Table Settings Displaying the Dynamic Address Table 2. Select Configure Aging from the Action list. 3. Modify the aging status if required. 4. Specify a new aging time. 5. Click Apply. Figure 100: Setting the Address Aging Time Displaying the Dynamic Address Table Use the MAC Address > Dynamic (Show Dynamic MAC) page to display the MAC addresses learned by monitoring the source address for traffic entering the switch.
Chapter 6 | Address Table Settings Clearing the Dynamic Address Table 2. Select Show Dynamic MAC from the Action list. 3. Select the Sort Key (MAC Address, VLAN, or Interface). 4. Enter the search parameters (MAC Address, VLAN, or Interface). 5. Click Query. Figure 101: Displaying the Dynamic MAC Address Table Clearing the Dynamic Address Table Use the MAC Address > Dynamic (Clear Dynamic MAC) page to remove any learned entries from the forwarding database.
Chapter 6 | Address Table Settings Configuring MAC Address Mirroring 5. Click Clear. Figure 102: Clearing Entries in the Dynamic MAC Address Table Configuring MAC Address Mirroring Use the MAC Address > Mirror (Add) page to mirror traffic matching a specified source address from any port on the switch to a target port for real-time analysis. You can then attach a logic analyzer or RMON probe to the target port and study the traffic crossing the source port in a completely unobtrusive manner.
Chapter 6 | Address Table Settings Issuing MAC Address Traps Web Interface To mirror packets based on a MAC address: 1. Click MAC Address, Mirror. 2. Select Add from the Action list. 3. Specify the source MAC address and destination port. 4. Click Apply. Figure 103: Mirroring Packets Based on the Source MAC Address To show the MAC addresses to be mirrored: 1. Click MAC Address, Mirror. 2. Select Show from the Action list.
Chapter 6 | Address Table Settings Issuing MAC Address Traps ◆ MAC Notification Traps – Issues a trap when a dynamic MAC address is added or removed. (Default: Disabled) ◆ MAC Notification Trap Interval – Specifies the interval between issuing two consecutive traps. (Range: 1-3600 seconds; Default: 1 second) Configure Interface ◆ Port – Port Identifier. (Range: 1-28/52) ◆ MAC Notification Trap – Enables MAC authentication traps on the current interface.
Chapter 6 | Address Table Settings Issuing MAC Address Traps Figure 106: Issuing MAC Address Traps (Interface Configuration) – 193 –
Chapter 6 | Address Table Settings Issuing MAC Address Traps – 194 –
7 Spanning Tree Algorithm This chapter describes the following basic topics: ◆ Loopback Detection – Configures detection and response to loopback BPDUs. ◆ Global Settings for STA – Configures global bridge settings for STP, RSTP and MSTP. ◆ Interface Settings for STA – Configures interface settings for STA, including priority, path cost, link type, and designation as an edge port.
Chapter 7 | Spanning Tree Algorithm Overview ports, and disables all other ports. Network packets are therefore only forwarded between root ports and designated ports, eliminating any possible network loops. Figure 107: STP Root Ports and Designated Ports Designated Root x x x Designated Bridge x Designated Port Root Port x Once a stable network topology has been established, all bridges listen for Hello BPDUs (Bridge Protocol Data Units) transmitted from the Root Bridge.
Chapter 7 | Spanning Tree Algorithm Overview Figure 108: MSTP Region, Internal Spanning Tree, Multiple Spanning Tree IST (for this Region) MST 1 Region R MST 2 An MST Region consists of a group of interconnected bridges that have the same MST Configuration Identifiers (including the Region Name, Revision Level and Configuration Digest – see “Configuring Multiple Spanning Trees” on page 214). An MST Region may contain multiple MSTP Instances.
Chapter 7 | Spanning Tree Algorithm Configuring Loopback Detection Configuring Loopback Detection Use the Spanning Tree > Loopback Detection page to configure loopback detection on an interface. When loopback detection is enabled and a port or trunk receives it’s own BPDU, the detection agent drops the loopback BPDU, sends an SNMP trap, and places the interface in discarding mode. This loopback state can be released manually or automatically.
Chapter 7 | Spanning Tree Algorithm Configuring Loopback Detection If an interface is shut down due to a detected loopback, and the release mode is set to “Auto,” the selected interface will be automatically enabled when the shutdown interval has expired. If an interface is shut down due to a detected loopback, and the release mode is set to “Manual,” the interface can be re-enabled using the Release button. Web Interface To configure loopback detection: 1. Click Spanning Tree, Loopback Detection. 2.
Chapter 7 | Spanning Tree Algorithm Configuring Global Settings for STA Configuring Global Settings for STA Use the Spanning Tree > STA (Configure Global - Configure) page to configure global settings for the spanning tree that apply to the entire switch. Command Usage ◆ Spanning Tree Protocol3 This option uses RSTP set to STP forced compatibility mode. It uses RSTP for the internal state machine, but sends only 802.1D BPDUs. This creates one spanning tree instance for the entire network.
Chapter 7 | Spanning Tree Algorithm Configuring Global Settings for STA Parameters These parameters are displayed: Basic Configuration of Global Settings ◆ Spanning Tree Status – Enables/disables STA on this switch. (Default: Enabled) ◆ Spanning Tree Type – Specifies the type of spanning tree used on this switch: ◆ ■ STP: Spanning Tree Protocol (IEEE 802.1D); i.e., when this option is selected, the switch will use RSTP set to STP forced compatibility mode). ■ RSTP: Rapid Spanning Tree (IEEE 802.
Chapter 7 | Spanning Tree Algorithm Configuring Global Settings for STA Advanced Configuration Settings The following attributes are based on RSTP, but also apply to STP since the switch uses a backwards-compatible subset of RSTP to implement STP, and also apply to MSTP which is based on RSTP according to the standard: ◆ ◆ Path Cost Method – The path cost is used to determine the best path between devices.
Chapter 7 | Spanning Tree Algorithm Configuring Global Settings for STA ■ Maximum: 30 RSTP does not depend on the forward delay timer in most cases. It is able to confirm that a port can transition to the forwarding state without having to rely on any timer configuration. To achieve fast convergence, RSTP relies on the use of edge ports, and automatic detection of point-to-point link types, both of which allow a port to directly transition to the forwarding state.
Chapter 7 | Spanning Tree Algorithm Configuring Global Settings for STA Figure 111: Configuring Global Settings for STA (STP) Figure 112: Configuring Global Settings for STA (RSTP) – 204 –
Chapter 7 | Spanning Tree Algorithm Displaying Global Settings for STA Figure 113: Configuring Global Settings for STA (MSTP) Displaying Global Settings for STA Use the Spanning Tree > STA (Configure Global - Show Information) page to display a summary of the current bridge STA information that applies to the entire switch.
Chapter 7 | Spanning Tree Algorithm Configuring Interface Settings for STA root port, then this switch has been accepted as the root device of the Spanning Tree network. ◆ Root Path Cost – The path cost from the root port on this switch to the root device. ◆ Configuration Changes – The number of times the Spanning Tree has been reconfigured. ◆ Last Topology Change – Time since the Spanning Tree was last reconfigured. Web Interface To display global STA settings: 1. Click Spanning Tree, STA. 2.
Chapter 7 | Spanning Tree Algorithm Configuring Interface Settings for STA ◆ Spanning Tree – Enables/disables STA on this interface. (Default: Enabled) ◆ BPDU Flooding - Enables/disables the flooding of BPDUs to other ports when global spanning tree is disabled (page 200) or when spanning tree is disabled on a specific port.
Chapter 7 | Spanning Tree Algorithm Configuring Interface Settings for STA Table 12: Default STA Path Costs Port Type Short Path Cost (IEEE 802.1D-1998) Long Path Cost (IEEE 802.1D-2004) Ethernet 65,535 1,000,000 Fast Ethernet 65,535 100,000 Gigabit Ethernet 10,000 10,000 Administrative path cost cannot be used to directly determine the root port on a switch. Connections to other devices use IEEE 802.1Q-2005 to determine the root port as in the following example.
Chapter 7 | Spanning Tree Algorithm Configuring Interface Settings for STA by taking over as the root port and forming a new spanning tree topology. It could also be used to form a border around part of the network where the root bridge is allowed. (Default: Disabled) ◆ Admin Edge Port – Since end nodes cannot cause forwarding loops, they can pass directly through to the spanning tree forwarding state.
Chapter 7 | Spanning Tree Algorithm Configuring Interface Settings for STA ◆ BPDU Guard – This feature protects edge ports from receiving BPDUs. It prevents loops by shutting down an edge port when a BPDU is received instead of putting it into the spanning tree discarding state. In a valid configuration, configured edge ports should not receive BPDUs. If an edge port receives a BPDU an invalid configuration exists, such as a connection to an unauthorized device.
Chapter 7 | Spanning Tree Algorithm Displaying Interface Settings for STA Figure 116: Configuring Interface Settings for STA Displaying Interface Settings for STA Use the Spanning Tree > STA (Configure Interface - Show Information) page to display the current status of ports or trunks in the Spanning Tree. Parameters These parameters are displayed: ◆ Spanning Tree – Shows if STA has been enabled on this interface.
Chapter 7 | Spanning Tree Algorithm Displaying Interface Settings for STA ■ If two ports of a switch are connected to the same segment and there is no other STA device attached to this segment, the port with the smaller ID forwards packets and the other is discarding. ■ All ports are discarding when the switch is booted, then some of them change state to learning, and then to forwarding.
Chapter 7 | Spanning Tree Algorithm Displaying Interface Settings for STA Figure 117: STA Port Roles R: Root Port A: Alternate Port D: Designated Port B: Backup Port Alternate port receives more useful BPDUs from another bridge and is therefore not selected as the designated R port. R A D x R A x Backup port receives more useful BPDUs from the same bridge and is therefore not selected as the designated port.
Chapter 7 | Spanning Tree Algorithm Configuring Multiple Spanning Trees Figure 118: Displaying Interface Settings for STA Configuring Multiple Spanning Trees Use the Spanning Tree > MSTP (Configure Global) page to create an MSTP instance, or to add VLAN groups to an MSTP instance. Command Usage MSTP generates a unique spanning tree for each instance.
Chapter 7 | Spanning Tree Algorithm Configuring Multiple Spanning Trees Note: All VLANs are automatically added to the IST (Instance 0). To ensure that the MSTI maintains connectivity across the network, you must configure a related set of bridges with the same MSTI settings. Parameters These parameters are displayed: ◆ MST ID – Instance identifier to configure. (Range: 0-4094) ◆ VLAN ID – VLAN to assign to this MST instance. (Range: 1-4094) ◆ Priority – The priority of a spanning tree instance.
Chapter 7 | Spanning Tree Algorithm Configuring Multiple Spanning Trees To show the MSTP instances: 1. Click Spanning Tree, MSTP. 2. Select Configure Global from the Step list. 3. Select Show from the Action list. Figure 120: Displaying MST Instances To modify the priority for an MST instance: 1. Click Spanning Tree, MSTP. 2. Select Configure Global from the Step list. 3. Select Modify from the Action list. 4. Modify the priority for an MSTP Instance. 5. Click Apply.
Chapter 7 | Spanning Tree Algorithm Configuring Multiple Spanning Trees 4. Select an MST ID. The attributes displayed on this page are described under “Displaying Global Settings for STA” on page 205. Figure 122: Displaying Global Settings for an MST Instance To add additional VLAN groups to an MSTP instance: 1. Click Spanning Tree, MSTP. 2. Select Configure Global from the Step list. 3. Select Add Member from the Action list. 4. Select an MST instance from the MST ID list. 5.
Chapter 7 | Spanning Tree Algorithm Configuring Interface Settings for MSTP To show the VLAN members of an MSTP instance: 1. Click Spanning Tree, MSTP. 2. Select Configure Global from the Step list. 3. Select Show Member from the Action list. Figure 124: Displaying Members of an MST Instance Configuring Interface Settings for MSTP Use the Spanning Tree > MSTP (Configure Interface - Configure) page to configure the STA interface settings for an MST instance.
Chapter 7 | Spanning Tree Algorithm Configuring Interface Settings for MSTP ◆ Priority – Defines the priority used for this port in the Spanning Tree Protocol. If the path cost for all ports on a switch are the same, the port with the highest priority (i.e., lowest value) will be configured as an active link in the Spanning Tree. This makes a port with higher priority less likely to be blocked if the Spanning Tree Protocol is detecting network loops.
Chapter 7 | Spanning Tree Algorithm Configuring Interface Settings for MSTP To display MSTP parameters for a port or trunk: 1. Click Spanning Tree, MSTP. 2. Select Configure Interface from the Step list. 3. Select Show Information from the Action list.
8 Congestion Control The switch can set the maximum upload or download data transfer rate for any port. It can also control traffic storms by setting a maximum threshold for broadcast traffic or multicast traffic. It can also set bounding thresholds for broadcast and multicast storms which can be used to automatically trigger rate limits or to shut down a port. Congestion Control includes following options: ◆ Rate Limiting – Sets the input and output rate limits for a port.
Chapter 8 | Congestion Control Storm Control Web Interface To configure rate limits: 1. Click Traffic, Rate Limit. 2. Set the interface type to Port or Trunk. 3. Enable the Rate Limit Status for the required interface. 4. Set the rate limit for required interfaces. 5. Click Apply. Figure 127: Configuring Rate Limits Storm Control Use the Traffic > Storm Control page to configure broadcast, multicast, and unknown unicast storm control thresholds.
Chapter 8 | Congestion Control Storm Control port. Enabling hardware-level storm control on a port will disable automatic storm control on that port. ◆ Rate limits set by the storm control function are also used by automatic storm control when the control response is set to rate control on the Auto Traffic Control (Configure Interface) page. ◆ Using both rate limiting and storm control on the same interface may lead to unexpected results.
Chapter 8 | Congestion Control Automatic Traffic Control Figure 128: Configuring Storm Control Automatic Traffic Control Use the Traffic > Auto Traffic Control pages to configure bounding thresholds for broadcast and multicast storms which can automatically trigger rate limits or shut down a port. Command Usage ATC includes storm control for broadcast or multicast traffic. The control response for either of these traffic types is the same, as shown in the following diagrams.
Chapter 8 | Congestion Control Automatic Traffic Control ◆ Alarm Clear Threshold – The lower threshold beneath which a control response can be automatically terminated after the release timer expires. When ingress traffic falls below this threshold, ATC sends a Storm Alarm Clear Trap and logs it. ◆ When traffic falls below the alarm clear threshold after the release timer expires, traffic control (for rate limiting) will be stopped and a Traffic Control Release Trap sent and logged.
Chapter 8 | Congestion Control Automatic Traffic Control Setting the ATC Timers Use the Traffic > Auto Traffic Control (Configure Global) page to set the time at which to apply the control response after ingress traffic has exceeded the upper threshold, and the time at which to release the control response after ingress traffic has fallen beneath the lower threshold.
Chapter 8 | Congestion Control Automatic Traffic Control Figure 131: Configuring ATC Timers Configuring ATC Use the Traffic > Auto Traffic Control (Configure Interface) page to set the storm Thresholds and control mode (broadcast or multicast), the traffic thresholds, the control response, Responses to automatically release a response of rate limiting, or to send related SNMP trap messages.
Chapter 8 | Congestion Control Automatic Traffic Control event is logged by the system and a Traffic Release Trap can be sent. (Default: Disabled) If automatic control release is not enabled and a control response of rate limiting has been triggered, you can manually stop the rate limiting response using the Manual Control Release attribute. If the control response has shut down a port, it can also be re-enabled using Manual Control Release.
Chapter 8 | Congestion Control Automatic Traffic Control Web Interface To configure the response timers for automatic storm control: 1. Click Traffic, Auto Traffic Control. 2. Select Configure Interface from the Step field. 3. Enable or disable ATC as required, set the control response, specify whether or not to automatically release the control response of rate limiting, set the upper and lower thresholds, and specify which trap messages to send. 4. Click Apply.
Chapter 8 | Congestion Control Automatic Traffic Control – 230 –
9 Class of Service Class of Service (CoS) allows you to specify which data packets have greater precedence when traffic is buffered in the switch due to congestion. This switch supports CoS with eight priority queues for each port. Data packets in a port’s highpriority queue will be transmitted before those in the lower-priority queues. You can set the default priority for each interface, and configure the mapping of frame priority tags to the switch’s priority queues.
Chapter 9 | Class of Service Layer 2 Queue Settings ◆ If the output port is an untagged member of the associated VLAN, these frames are stripped of all VLAN tags prior to transmission. Parameters These parameters are displayed: ◆ Interface – Displays a list of ports or trunks. ◆ CoS – The priority that is assigned to untagged frames received on the specified interface. (Range: 0-7; Default: 0) Web Interface To configure the queue mode: 1. Click Traffic, Priority, Default Priority. 2.
Chapter 9 | Class of Service Layer 2 Queue Settings the switch services each queue before moving on to the next queue. This prevents the head-of-line blocking that can occur with strict priority queuing. ◆ If Strict and WRR mode is selected, a combination of strict service is used for the high priority queues and weighted service for the remaining queues. The queues assigned to use strict priority should be specified using the Strict Mode field parameter.
Chapter 9 | Class of Service Layer 2 Queue Settings Web Interface To configure the queue mode: 1. Click Traffic, Priority, Queue. 2. Set the queue mode. 3. If the weighted queue mode is selected, the queue weight can be modified if required. 4. If the queue mode that uses a combination of strict and weighted queueing is selected, the queues which are serviced first must be specified by enabling strict mode parameter in the table. 5. Click Apply.
Chapter 9 | Class of Service Layer 2 Queue Settings Figure 136: Setting the Queue Mode (Strict and WRR) Mapping CoS Values Use the Traffic > Priority > PHB to Queue page to specify the hardware output to Egress Queues queues to use based on the internal per-hop behavior value. (For more information on exact manner in which the ingress priority tags are mapped to egress queues for internal processing, see “Mapping CoS Priorities to Internal DSCP Values” on page 241).
Chapter 9 | Class of Service Layer 2 Queue Settings Table 14: CoS Priority Levels (Continued) Priority Level Traffic Type 4 Controlled Load 5 Video, less than 100 milliseconds latency and jitter 6 Voice, less than 10 milliseconds latency and jitter 7 Network Control Command Usage ◆ Egress packets are placed into the hardware queues according to the mapping defined by this command. ◆ The default internal PHB to output queue mapping is shown below.
Chapter 9 | Class of Service Layer 3/4 Priority Settings Figure 137: Mapping CoS Values to Egress Queues To show the internal PHB to hardware queue map: 1. Click Traffic, Priority, PHB to Queue. 2. Select Show from the Action list. 3. Select an interface. Figure 138: Showing CoS Values to Egress Queue Mapping Layer 3/4 Priority Settings Mapping Layer 3/4 Priorities to CoS Values The switch supports several common methods of prioritizing layer 3/4 traffic to meet application requirements.
Chapter 9 | Class of Service Layer 3/4 Priority Settings Because different priority information may be contained in the traffic, this switch maps priority values to the output queues in the following manner – The precedence for priority mapping is DSCP Priority and then Default Port Priority. Note: The default settings used for mapping priority values from ingress traffic to internal DSCP values are used to determine the hardware queues used for egress traffic, not to replace the priority values.
Chapter 9 | Class of Service Layer 3/4 Priority Settings ◆ Drop Precedence – Drop precedence used for Random Early Detection in controlling traffic congestion. (Range: 0 - Green, 3 - Yellow, 1 - Red) Table 16: Default Mapping of DSCP Values to Internal PHB/Drop Values ingressdscp1 0 1 2 3 4 5 6 7 8 9 0 0,0 0,1 0,0 0,3 0,0 0,1 0,0 0,3 1,0 1,1 1 1,0 1,3 1,0 1,1 1,0 1,3 2,0 2,1 2,0 2,3 2 2,0 2,1 2,0 2,3 3,0 3,1 3,0 3,3 3.
Chapter 9 | Class of Service Layer 3/4 Priority Settings To show the DSCP to internal PHB/drop precedence map: 1. Click Traffic, Priority, DSCP to DSCP. 2. Select Show from the Action list. 3. Select a port. Figure 140: Showing DSCP to DSCP Internal Mapping Setting Priority The switch allows a choice between using DSCP or CoS priority processing Processing to DSCP or methods. Use the Priority > Trust Mode page to select the required processing CoS method.
Chapter 9 | Class of Service Layer 3/4 Priority Settings ◆ Trust Mode ■ CoS – Maps layer 3/4 priorities using Class of Service values. (This is the default setting.) ■ DSCP – Maps layer 3/4 priorities using Differentiated Services Code Point values. Web Interface To configure the trust mode: 1. Click Traffic, Priority, Trust Mode. 2. Set the trust mode for any port. 3. Click Apply.
Chapter 9 | Class of Service Layer 3/4 Priority Settings Parameters These parameters are displayed: ◆ CoS – CoS value in ingress packets. (Range: 0-7) ◆ CFI – Canonical Format Indicator. Set to this parameter to “0” to indicate that the MAC address information carried in the frame is in canonical format. (Range: 0-1) ◆ PHB – Per-hop behavior, or the priority used for this router hop. (Range: 0-7) ◆ Drop Precedence – Drop precedence used for controlling traffic congestion.
Chapter 9 | Class of Service Layer 3/4 Priority Settings Figure 142: Configuring CoS to DSCP Internal Mapping To show the CoS/CFI to internal PHB/drop precedence map: 1. Click Traffic, Priority, CoS to DSCP. 2. Select Show from the Action list. 3. Select a port.
Chapter 9 | Class of Service Layer 3/4 Priority Settings – 244 –
10 Quality of Service This chapter describes the following tasks required to apply QoS policies: Class Map – Creates a map which identifies a specific class of traffic. Policy Map – Sets the boundary parameters used for monitoring inbound traffic, and the action to take for conforming and non-conforming traffic. Binding to a Port – Applies a policy map to an ingress port.
Chapter 10 | Quality of Service Configuring a Class Map Command Usage To create a service policy for a specific category or ingress traffic, follow these steps: 1. Use the Configure Class (Add) page to designate a class name for a specific category of traffic. 2. Use the Configure Class (Add Rule) page to edit the rules for each class which specify a type of traffic based on an access list, a DSCP or IP Precedence value, a VLAN, a CoS value, or a source port. 3.
Chapter 10 | Quality of Service Configuring a Class Map Add Rule ◆ Class Name – Name of the class map. ◆ Type – The criteria specified by the match command. (This field is set on the Add page.) ◆ ACL – Name of an access control list. Any type of ACL can be specified, including standard or extended IPv4/IPv6 ACLs and MAC ACLs. ◆ IP DSCP – A DSCP value. (Range: 0-63) ◆ IP Precedence – An IP Precedence value. (Range: 0-7) ◆ IPv6 DSCP – A DSCP value contained in an IPv6 packet.
Chapter 10 | Quality of Service Configuring a Class Map To show the configured class maps: 1. Click Traffic, DiffServ. 2. Select Configure Class from the Step list. 3. Select Show from the Action list. Figure 145: Showing Class Maps To edit the rules for a class map: 1. Click Traffic, DiffServ. 2. Select Configure Class from the Step list. 3. Select Add Rule from the Action list. 4. Select the name of a class map. 5.
Chapter 10 | Quality of Service Configuring a Class Map Figure 146: Adding Rules to a Class Map To show the rules for a class map: 1. Click Traffic, DiffServ. 2. Select Configure Class from the Step list. 3. Select Show Rule from the Action list.
Chapter 10 | Quality of Service Creating QoS Policies Creating QoS Policies Use the Traffic > DiffServ (Configure Policy) page to create a policy map that can be attached to multiple interfaces. A policy map is used to group one or more class map statements (page 246), modify service tagging, and enforce bandwidth policing. A policy map can then be bound by a service policy to one or more interfaces (page 261). Configuring QoS policies requires several steps.
Chapter 10 | Quality of Service Creating QoS Policies ◆ The meter operates in one of two modes. In the color-blind mode, the meter assumes that the packet stream is uncolored. In color-aware mode the meter assumes that some preceding entity has pre-colored the incoming packet stream so that each packet is either green, yellow, or red. The marker (re)colors an IP packet according to the results of the meter. The color is coded in the DS field [RFC 2474] of the packet.
Chapter 10 | Quality of Service Creating QoS Policies trTCM Police Meter – Defines an enforcer for classified traffic based on a two rate three color meter scheme defined in RFC 2698. This metering policy monitors a traffic stream and processes its packets according to the committed information rate (CIR, or maximum throughput), peak information rate (PIR), and their associated burst sizes – committed burst size (BC, or burst rate), and peak burst size (BP).
Chapter 10 | Quality of Service Creating QoS Policies ◆ ■ if the packet has been precolored as yellow or if Tc(t)-B < 0, the packet is yellow and Tp is decremented by B, else ■ the packet is green and both Tp and Tc are decremented by B. The trTCM can be used to mark a IP packet stream in a service, where different, decreasing levels of assurances (either absolute or relative) are given to packets which are green, yellow, or red. Refer to RFC 2698 for more information on other aspects of trTCM.
Chapter 10 | Quality of Service Creating QoS Policies See Table 16, “Default Mapping of DSCP Values to Internal PHB/Drop Values,” on page 239). ■ Set IP DSCP – Configures the service provided to ingress traffic by setting an IP DSCP value for a matching packet (as specified in rule settings for a class map). (Range: 0-63) ◆ Meter – Check this to define the maximum throughput, burst rate, and the action that results from a policy violation. ◆ Meter Mode – Selects one of the following policing methods.
Chapter 10 | Quality of Service Creating QoS Policies value, or drop a packet, the switch will also mark the two color bits used to set the drop precedence of a packet for Random Early Detection. The color modes include “Color-Blind” which assumes that the packet stream is uncolored, and “Color-Aware” which assumes that the incoming packets are pre-colored. The functional differences between these modes is described at the beginning of this section under “srTCM Police Meter.
Chapter 10 | Quality of Service Creating QoS Policies actions defined by this command to transmit, remark the DSCP service value, or drop a packet, the switch will also mark the two color bits used to set the drop precedence of a packet for Random Early Detection. The color modes include “Color-Blind” which assumes that the packet stream is uncolored, and “Color-Aware” which assumes that the incoming packets are pre-colored.
Chapter 10 | Quality of Service Creating QoS Policies ■ ◆ Drop – Drops out of conformance traffic. Priority – The priority assigned to the designated traffic flow. (Range: 0-1000; Default: None) Configure Bundle ◆ Policy Name – Name of policy map. (Range: 1-32 characters) ◆ Index – Index for group of class maps. (Range: 1-3) ◆ Bundle Rate – Maximum flow rate for a group of traffic flows.
Chapter 10 | Quality of Service Creating QoS Policies To show the configured policy maps: 1. Click Traffic, DiffServ. 2. Select Configure Policy from the Step list. 3. Select Show from the Action list. Figure 149: Showing Policy Maps To edit the rules for a policy map: 1. Click Traffic, DiffServ. 2. Select Configure Policy from the Step list. 3. Select Add Rule from the Action list. 4. Select the name of a policy map. 5.
Chapter 10 | Quality of Service Creating QoS Policies Figure 150: Adding Rules to a Policy Map To show the rules for a policy map: 1. Click Traffic, DiffServ. 2. Select Configure Policy from the Step list. 3. Select Show Rule from the Action list.
Chapter 10 | Quality of Service Creating QoS Policies To configure a bundle rate for a group of traffic flows: 1. Click Traffic, DiffServ. 2. Select Configure Policy from the Step list. 3. Select Configure Bundle from the Action list. 4. Specify the index, bundle rate, and class maps. 5. Click Apply. Figure 152: Configuring a Bundle Rate for a Group of Traffic Flows To show the bundle rate for a group of traffic flows: 1. Click Traffic, DiffServ. 2. Select Configure Policy from the Step list. 3.
Chapter 10 | Quality of Service Attaching a Policy Map to a Port Attaching a Policy Map to a Port Use the Traffic > DiffServ (Configure Interface) page to bind a policy map to a port. Command Usage First define a class map, define a policy map, and then bind the service policy to the required interface. Parameters These parameters are displayed: ◆ Port – Specifies a port. ◆ Ingress – Applies the selected rule to ingress traffic. ◆ Egress – Applies the selected rule to egress traffic.
Chapter 10 | Quality of Service Attaching a Policy Map to a Port Figure 154: Attaching a Policy Map to a Port – 262 –
11 VoIP Traffic Configuration This chapter covers the following topics: ◆ Global Settings – Enables VOIP globally, sets the Voice VLAN, and the aging time for attached ports. ◆ Telephony OUI List – Configures the list of phones to be treated as VOIP devices based on the specified Organization Unit Identifier (OUI).
Chapter 11 | VoIP Traffic Configuration Configuring VoIP Traffic also be set to remove a port from the Voice VLAN when VoIP traffic is no longer received on the port. Command Usage All ports are set to VLAN hybrid mode by default. Prior to enabling VoIP for a port (by setting the VoIP mode to Auto or Manual as described below), first ensure that VLAN membership is not set to access mode (see “Adding Static Members to VLANs” on page 155).
Chapter 11 | VoIP Traffic Configuration Configuring Telephony OUI Figure 155: Configuring a Voice VLAN Configuring Telephony OUI VoIP devices attached to the switch can be identified by the vendor’s Organizational Unique Identifier (OUI) in the source MAC address of received packets. OUI numbers are assigned to vendors and form the first three octets of device MAC addresses. The MAC OUI numbers for VoIP equipment can be configured on the switch so that traffic from these devices is recognized as VoIP.
Chapter 11 | VoIP Traffic Configuration Configuring VoIP Traffic Ports 6. Enter a description for the devices. 7. Click Apply. Figure 156: Configuring an OUI Telephony List To show the MAC OUI numbers used for VoIP equipment: 1. Click Traffic, VoIP. 2. Select Configure OUI from the Step list. 3. Select Show from the Action list.
Chapter 11 | VoIP Traffic Configuration Configuring VoIP Traffic Ports VLAN membership is not set to access mode (see “Adding Static Members to VLANs” on page 155). Parameters These parameters are displayed: ◆ Mode – Specifies if the port will be added to the Voice VLAN when VoIP traffic is detected. (Default: None) ■ None – The Voice VLAN feature is disabled on the port. The port will not detect VoIP traffic or be added to the Voice VLAN.
Chapter 11 | VoIP Traffic Configuration Configuring VoIP Traffic Ports traffic is no longer received on the port. Alternatively, if you clear the MAC address table manually, then the switch will also start counting down the Remaining Age. When VoIP Mode is set to Auto, the Remaining Age will be displayed. Otherwise, if the VoIP Mode is Disabled or set to Manual, the remaining age will display “NA.” Web Interface To configure VoIP traffic settings for a port: 1. Click Traffic, VoIP. 2.
12 Security Measures You can configure this switch to authenticate users logging into the system for management access using local or remote authentication methods. Port-based authentication using IEEE 802.1X can also be configured to control either management access to the uplink ports or client access to the data ports.
Chapter 12 | Security Measures AAA (Authentication, Authorization and Accounting) ◆ DHCP Snooping – Filter IP traffic on insecure ports for which the source address cannot be identified via DHCP snooping. Note: The priority of execution for the filtering commands is Port Security, Port Authentication, Network Access, Web Authentication, Access Control Lists, IP Source Guard, and then DHCP Snooping.
Chapter 12 | Security Measures AAA (Authentication, Authorization and Accounting) To configure AAA on the switch, you need to follow this general process: 1. Configure RADIUS and TACACS+ server access parameters. See “Configuring Local/Remote Logon Authentication” on page 271. 2. Define RADIUS and TACACS+ server groups to support the accounting and authorization of services. 3.
Chapter 12 | Security Measures AAA (Authentication, Authorization and Accounting) ■ TACACS – User authentication is performed using a TACACS+ server only. ■ [authentication sequence] – User authentication is performed by up to three authentication methods in the indicated sequence. Web Interface To configure the method(s) of controlling management access: 1. Click Security, AAA, System Authentication. 2. Specify the authentication sequence (i.e., one to three methods). 3. Click Apply.
Chapter 12 | Security Measures AAA (Authentication, Authorization and Accounting) RADIUS encrypts only the password in the access-request packet from the client to the server, while TACACS+ encrypts the entire body of the packet. Command Usage ◆ If a remote authentication server is used, you must specify the message exchange parameters for the remote authentication protocol. Both local and remote logon authentication control management access via the console port, web browser, or Telnet.
Chapter 12 | Security Measures AAA (Authentication, Authorization and Accounting) ◆ ■ Authentication Key – Encryption key used to authenticate logon access for client. Enclose any string containing blank spaces in double quotes. (Maximum length: 48 characters) ■ Confirm Authentication Key – Re-type the string entered in the previous field to ensure no errors were made. The switch will not change the encryption key if these two fields do not match.
Chapter 12 | Security Measures AAA (Authentication, Authorization and Accounting) Web Interface To configure the parameters for RADIUS or TACACS+ authentication: 1. Click Security, AAA, Server. 2. Select Configure Server from the Step list. 3. Select RADIUS or TACACS+ server type. 4. Select Global to specify the parameters that apply globally to all specified servers, or select a specific Server Index to specify the parameters that apply to a specific server. 5.
Chapter 12 | Security Measures AAA (Authentication, Authorization and Accounting) Figure 162: Configuring Remote Authentication Server (TACACS+) To configure the RADIUS or TACACS+ server groups to use for accounting and authorization: 1. Click Security, AAA, Server. 2. Select Configure Group from the Step list. 3. Select Add from the Action list. 4. Select RADIUS or TACACS+ server type. 5. Enter the group name, followed by the index of the server to use for each priority level. 6. Click Apply.
Chapter 12 | Security Measures AAA (Authentication, Authorization and Accounting) To show the RADIUS or TACACS+ server groups used for accounting and authorization: 1. Click Security, AAA, Server. 2. Select Configure Group from the Step list. 3. Select Show from the Action list.
Chapter 12 | Security Measures AAA (Authentication, Authorization and Accounting) ◆ Method Name – Specifies an accounting method for service requests. The “default” methods are used for a requested service if no other methods have been defined. (Range: 1-64 characters) Note that the method name is only used to describe the accounting method configured on the specified RADIUS or TACACS+ servers. No information is sent to the servers about the method to use.
Chapter 12 | Security Measures AAA (Authentication, Authorization and Accounting) ◆ Accounting Type - Displays the accounting service. ◆ Interface - Displays the receive port number through which this user accessed the switch. ◆ Time Elapsed - Displays the length of time this entry has been active. Web Interface To configure global settings for AAA accounting: 1. Click Security, AAA, Accounting. 2. Select Configure Global from the Step list. 3. Enter the required update interval. 4. Click Apply.
Chapter 12 | Security Measures AAA (Authentication, Authorization and Accounting) To configure the accounting method applied to various service types and the assigned server group: 1. Click Security, AAA, Accounting. 2. Select Configure Method from the Step list. 3. Select Add from the Action list. 4. Select the accounting type (802.1X, Exec). 5. Specify the name of the accounting method and server group name. 6. Click Apply.
Chapter 12 | Security Measures AAA (Authentication, Authorization and Accounting) To configure the accounting method applied to specific interfaces, and local console, Telnet, or SSH connections: 1. Click Security, AAA, Accounting. 2. Select Configure Service from the Step list. 3. Select the accounting type (802.1X, Exec). 4. Enter the required accounting method. 5. Click Apply. Figure 168: Configuring AAA Accounting Service for 802.
Chapter 12 | Security Measures AAA (Authentication, Authorization and Accounting) To display a summary of the configured accounting methods and assigned server groups for specified service types: 1. Click Security, AAA, Accounting. 2. Select Show Information from the Step list. 3. Click Summary. Figure 170: Displaying a Summary of Applied AAA Accounting Methods To display basic accounting information and statistics recorded for user sessions: 1. Click Security, AAA, Accounting. 2.
Chapter 12 | Security Measures AAA (Authentication, Authorization and Accounting) Parameters These parameters are displayed: Configure Method ◆ Authorization Type – Specifies the service as Exec, indicating administrative authorization for local console, Telnet, or SSH connections. ◆ Method Name – Specifies an authorization method for service requests. The “default” method is used for a requested service if no other methods have been defined.
Chapter 12 | Security Measures AAA (Authentication, Authorization and Accounting) Web Interface To configure the authorization method applied to the Exec service type and the assigned server group: 1. Click Security, AAA, Authorization. 2. Select Configure Method from the Step list. 3. Specify the name of the authorization method and server group name. 4. Click Apply.
Chapter 12 | Security Measures AAA (Authentication, Authorization and Accounting) To configure the authorization method applied to local console, Telnet, or SSH connections: 1. Click Security, AAA, Authorization. 2. Select Configure Service from the Step list. 3. Enter the required authorization method. 4. Click Apply. Figure 174: Configuring AAA Authorization Methods for Exec Service To display a the configured authorization method and assigned server groups for The Exec service type: 1.
Chapter 12 | Security Measures Configuring User Accounts Configuring User Accounts Use the Security > User Accounts page to control management access to the switch based on manually configured user names and passwords. Command Usage ◆ The default guest name is “guest” with the password “guest.” The default administrator name is “admin” with the password “admin.” ◆ The guest only has read access for most configuration parameters.
Chapter 12 | Security Measures Configuring User Accounts Web Interface To configure user accounts: 1. Click Security, User Accounts. 2. Select Add from the Action list. 3. Specify a user name, select the user's access level, then enter a password if required and confirm it. 4. Click Apply. Figure 176: Configuring User Accounts To show user accounts: 1. Click Security, User Accounts. 2. Select Show from the Action list.
Chapter 12 | Security Measures Web Authentication Web Authentication Web authentication allows stations to authenticate and access the network in situations where 802.1X or Network Access authentication are infeasible or impractical. The web authentication feature allows unauthenticated hosts to request and receive a DHCP assigned IP address and perform DNS queries. All other traffic, except for HTTP protocol traffic, is blocked.
Chapter 12 | Security Measures Web Authentication Web Interface To configure global parameters for web authentication: 1. Click Security, Web Authentication. 2. Select Configure Global from the Step list. 3. Enable web authentication globally on the switch, and adjust any of the protocol parameters as required. 4. Click Apply.
Chapter 12 | Security Measures Network Access (MAC Address Authentication) Web Interface To enable web authentication for a port: 1. Click Security, Web Authentication. 2. Select Configure Interface from the Step list. 3. Set the status box to enabled for any port that requires web authentication, and click Apply. 4. Mark the check box for any host addresses that need to be re-authenticated, and click Re-authenticate.
Chapter 12 | Security Measures Network Access (MAC Address Authentication) While authentication for a MAC address is in progress, all traffic is blocked until authentication is completed. On successful authentication, the RADIUS server may optionally assign VLAN and quality of service settings for the switch port. ◆ When enabled on a port, the authentication process sends a Password Authentication Protocol (PAP) request to a configured RADIUS server.
Chapter 12 | Security Measures Network Access (MAC Address Authentication) Table 18: Dynamic QoS Profiles (Continued) ◆ Profile Attribute Syntax Example IPv6 ACL ipv6-access-group-in=ipv6-acl-name ipv6-access-group-in=ipv6acl MAC ACL mac-access-group-in=mac-acl-name mac-access-group-in=macAcl Multiple profiles can be specified in the Filter-ID attribute by using a semicolon to separate each profile.
Chapter 12 | Security Measures Network Access (MAC Address Authentication) Configuring MAC address authentication is configured on a per-port basis, however there are Global Settings for two configurable parameters that apply globally to all ports on the switch. Use the Network Access Security > Network Access (Configure Global) page to configure MAC address authentication aging and reauthentication time.
Chapter 12 | Security Measures Network Access (MAC Address Authentication) Figure 180: Configuring Global Settings for Network Access Configuring Network Use the Security > Network Access (Configure Interface - General) page to Access for Ports configure MAC authentication on switch ports, including enabling address authentication, setting the maximum MAC count, and enabling dynamic VLAN or dynamic QoS assignments.
Chapter 12 | Security Measures Network Access (MAC Address Authentication) A port can only be assigned to the guest VLAN in case of failed authentication if switchort mode is set to Hybrid. (See “Adding Static Members to VLANs” on page 155.) ◆ Dynamic VLAN – Enables dynamic VLAN assignment for an authenticated port. When enabled, any VLAN identifiers returned by the RADIUS server through the 802.1X authentication process are applied to the port, providing the VLANs have already been created on the switch.
Chapter 12 | Security Measures Network Access (MAC Address Authentication) Figure 181: Configuring Interface Settings for Network Access Configuring Port Link Use the Security > Network Access (Configure Interface - Link Detection) page to Detection send an SNMP trap and/or shut down a port when a link event occurs. Parameters These parameters are displayed: ◆ Link Detection Status – Configures whether Link Detection is enabled or disabled for a port.
Chapter 12 | Security Measures Network Access (MAC Address Authentication) 3. Click the Link Detection button. 4. Modify the link detection status, trigger condition, and the response for any port. 5. Click Apply. Figure 182: Configuring Link Detection for Network Access Configuring a Use the Security > Network Access (Configure MAC Filter) page to designate MAC Address Filter specific MAC addresses or MAC address ranges as exempt from authentication.
Chapter 12 | Security Measures Network Access (MAC Address Authentication) Web Interface To add a MAC address filter for MAC authentication: 1. Click Security, Network Access. 2. Select Configure MAC Filter from the Step list. 3. Select Add from the Action list. 4. Enter a filter ID, MAC address, and optional mask. 5. Click Apply. Figure 183: Configuring a MAC Address Filter for Network Access To show the MAC address filter table for MAC authentication: 1. Click Security, Network Access. 2.
Chapter 12 | Security Measures Network Access (MAC Address Authentication) Displaying Secure Use the Security > Network Access (Show Information) page to display the MAC Address authenticated MAC addresses stored in the secure MAC address table. Information Information on the secure MAC entries can be displayed and selected entries can be removed from the table. Parameters These parameters are displayed: ◆ ◆ Query By – Specifies parameters to use in the MAC address query.
Chapter 12 | Security Measures Configuring HTTPS Figure 185: Showing Addresses Authenticated for Network Access Configuring HTTPS You can configure the switch to enable the Secure Hypertext Transfer Protocol (HTTPS) over the Secure Socket Layer (SSL), providing secure access (i.e., an encrypted connection) to the switch’s web interface. Configuring Global Use the Security > HTTPS (Configure Global) page to enable or disable HTTPS and Settings for HTTPS specify the TCP port used for this service.
Chapter 12 | Security Measures Configuring HTTPS ◆ The client and server establish a secure encrypted connection. A padlock icon should appear in the status bar for Internet Explorer 6, Mozilla Firefox 4, or Google Chrome 29, or more recent versions. ◆ The following web browsers and operating systems currently support HTTPS: Table 19: HTTPS System Support ◆ Web Browser Operating System Internet Explorer 9.
Chapter 12 | Security Measures Configuring HTTPS Figure 186: Configuring HTTPS Replacing the Default Use the Security > HTTPS (Copy Certificate) page to replace the default secure-site Secure-site Certificate certificate. When you log onto the web interface using HTTPS (for secure access), a Secure Sockets Layer (SSL) certificate appears for the switch. By default, the certificate that the web browser displays will be associated with a warning that the site is not recognized as a secure site.
Chapter 12 | Security Measures Configuring HTTPS ◆ Private Key Source File Name – Name of private key file stored on the TFTP server. ◆ Private Password – Password stored in the private key file. This password is used to verify authorization for certificate use, and is verified when downloading the certificate to the switch. ◆ Confirm Password – Re-type the string entered in the previous field to ensure no errors were made. The switch will not download the certificate if these two fields do not match.
Chapter 12 | Security Measures Configuring the Secure Shell Configuring the Secure Shell The Berkeley-standard includes remote access tools originally designed for Unix systems. Some of these tools have also been implemented for Microsoft Windows and other environments. These tools, including commands such as rlogin (remote login), rsh (remote shell), and rcp (remote copy), are not secure from hostile attacks.
Chapter 12 | Security Measures Configuring the Secure Shell 3. Import Client’s Public Key to the Switch – See “Importing User Public Keys” on page 309 to copy a file containing the public key for all the SSH client’s granted management access to the switch. (Note that these clients must be configured locally on the switch via the User Accounts page as described on page 286.) The clients are subsequently authenticated using these keys.
Chapter 12 | Security Measures Configuring the Secure Shell e.The switch compares the checksum sent from the client against that computed for the original string it sent. If the two checksums match, this means that the client's private key corresponds to an authorized public key, and the client is authenticated. Authenticating SSH v2 Clients a.The client first queries the switch to determine if DSA public key authentication using a preferred algorithm is acceptable. b.
Chapter 12 | Security Measures Configuring the Secure Shell ◆ Authentication Retries – Specifies the number of authentication attempts that a client is allowed before authentication fails and the client has to restart the authentication process. (Range: 1-5 times; Default: 3) ◆ Server-Key Size – Specifies the SSH server key size. (Range: 512-896 bits; Default:768) ■ The server key is a private key that is never shared outside the switch.
Chapter 12 | Security Measures Configuring the Secure Shell Parameters These parameters are displayed: ◆ Host-Key Type – The key type used to generate the host key pair (i.e., public and private keys). (Range: RSA (Version 1), DSA (Version 2), Both; Default: Both) The SSH server uses RSA or DSA for key exchange when the client first establishes a connection with the switch, and then negotiates with the client to select either DES (56-bit) or 3DES (168-bit) for data encryption.
Chapter 12 | Security Measures Configuring the Secure Shell Figure 190: Showing the SSH Host Key Pair Importing User Public Use the Security > SSH (Configure User Key - Copy) page to upload a user’s public Keys key to the switch. This public key must be stored on the switch for the user to be able to log in using the public key authentication mechanism. If the user’s public key does not exist on the switch, SSH will revert to the interactive password authentication mechanism to complete authentication.
Chapter 12 | Security Measures Configuring the Secure Shell Web Interface To copy the SSH user’s public key: 1. Click Security, SSH. 2. Select Configure User Key from the Step list. 3. Select Copy from the Action list. 4. Select the user name and the public-key type from the respective drop-down boxes, input the TFTP server IP address and the public key source file name. 5. Click Apply. Figure 191: Copying the SSH User’s Public Key To display or clear the SSH user’s public key: 1. Click Security, SSH.
Chapter 12 | Security Measures Access Control Lists Figure 192: Showing the SSH User’s Public Key Access Control Lists Access Control Lists (ACL) provide packet filtering for IPv4/IPv6 frames (based on address, protocol, Layer 4 protocol port number or TCP control code), IPv6 frames (based on address, DSCP traffic class, or next header type), or any frames (based on MAC address or Ethernet type).
Chapter 12 | Security Measures Access Control Lists possible depends on too many factors to be precisely determined. It depends on the amount of hardware resources reserved at runtime for this purpose. Auto ACE Compression is a software feature used to compress all the ACEs of an ACL to utilize hardware resources more efficiency. Without compression, one ACE would occupy a fixed number of entries in TCAM.
Chapter 12 | Security Measures Access Control Lists Parameters These parameters are displayed: Add ◆ Time-Range Name – Name of a time range. (Range: 1-16 characters) Add Rule ◆ Time-Range – Name of a time range. ◆ Mode ■ Absolute – Specifies a specific time or time range. ■ ■ Start/End – Specifies the hours, minutes, month, day, and year at which to start or end. Periodic – Specifies a periodic interval. ■ Start/To – Specifies the days of the week, hours, and minutes at which to start or end.
Chapter 12 | Security Measures Access Control Lists 3. Select Show from the Action list. Figure 194: Showing a List of Time Ranges To configure a rule for a time range: 1. Click Security, ACL. 2. Select Configure Time Range from the Step list. 3. Select Add Rule from the Action list. 4. Select the name of time range from the drop-down list. 5. Select a mode option of Absolute or Periodic. 6. Fill in the required parameters for the selected mode. 7. Click Apply.
Chapter 12 | Security Measures Access Control Lists 3. Select Show Rule from the Action list. Figure 196: Showing the Rules Configured for a Time Range Showing Use the Security > ACL (Configure ACL - Show TCAM) page to show utilization TCAM Utilization parameters for TCAM (Ternary Content Addressable Memory), including the number policy control entries in use, the number of free entries, and the overall percentage of TCAM in use.
Chapter 12 | Security Measures Access Control Lists Web Interface To show information on TCAM utilization: 1. Click Security, ACL. 2. Select Configure ACL from the Step list. 3. Select Show TCAM from the Action list. Figure 197: Showing TCAM Utilization Setting the ACL Name Use the Security > ACL (Configure ACL - Add) page to create an ACL. and Type Parameters These parameters are displayed: ◆ ACL Name – Name of the ACL.
Chapter 12 | Security Measures Access Control Lists Web Interface To configure the name and type of an ACL: 1. Click Security, ACL. 2. Select Configure ACL from the Step list. 3. Select Add from the Action list. 4. Fill in the ACL Name field, and select the ACL type. 5. Click Apply. Figure 198: Creating an ACL To show a list of ACLs: 1. Click Security, ACL. 2. Select Configure ACL from the Step list. 3. Select Show from the Action list.
Chapter 12 | Security Measures Access Control Lists Configuring a Use the Security > ACL (Configure ACL - Add Rule - IP Standard) page to Standard IPv4 ACL configure a Standard IPv4 ACL. Parameters These parameters are displayed: ◆ Type – Selects the type of ACLs to show in the Name list. ◆ Name – Shows the names of ACLs matching the selected type. ◆ Action – An ACL can contain any combination of permit or deny rules. ◆ Address Type – Specifies the source IP address.
Chapter 12 | Security Measures Access Control Lists Figure 200: Configuring a Standard IPv4 ACL Configuring an Use the Security > ACL (Configure ACL - Add Rule - IP Extended) page to Extended IPv4 ACL configure an Extended IPv4 ACL. Parameters These parameters are displayed: ◆ Type – Selects the type of ACLs to show in the Name list. ◆ Name – Shows the names of ACLs matching the selected type. ◆ Action – An ACL can contain any combination of permit or deny rules.
Chapter 12 | Security Measures Access Control Lists ◆ Service Type – Packet priority settings based on the following criteria: ■ Precedence – IP precedence level. (Range: 0-7) ■ DSCP – DSCP priority level. (Range: 0-63) ◆ Control Code – Decimal number (representing a bit string) that specifies flag bits in byte 14 of the TCP header. (Range: 0-63) ◆ Control Code Bit Mask – Decimal number representing the code bits to match.
Chapter 12 | Security Measures Access Control Lists 7. Select the address type (Any, Host, or IP). 8. If you select “Host,” enter a specific address. If you select “IP,” enter a subnet address and the mask for an address range. 9. Set any other required criteria, such as service type, protocol type, or control code. 10. Click Apply.
Chapter 12 | Security Measures Access Control Lists 8 colon-separated 16-bit hexadecimal values. One double colon may be used in the address to indicate the appropriate number of zeros required to fill the undefined fields. ◆ Source Prefix-Length – A decimal value indicating how many contiguous bits (from the left) of the address comprise the prefix (i.e., the network portion of the address). (Range: 0-128 bits) ◆ Time Range – Name of a time range. Web Interface To add rules to a Standard IPv6 ACL: 1.
Chapter 12 | Security Measures Access Control Lists Configuring an Use the Security > ACL (Configure ACL - Add Rule - IPv6 Extended) page Extended IPv6 ACL to configure an Extended IPv6 ACL. Parameters These parameters are displayed: ◆ Type – Selects the type of ACLs to show in the Name list. ◆ Name – Shows the names of ACLs matching the selected type. ◆ Action – An ACL can contain any combination of permit or deny rules. ◆ Source Address Type – Specifies the source IP address type.
Chapter 12 | Security Measures Access Control Lists ◆ Time Range – Name of a time range. Web Interface To add rules to an Extended IPv6 ACL: 1. Click Security, ACL. 2. Select Configure ACL from the Step list. 3. Select Add Rule from the Action list. 4. Select IPv6 Extended from the Type list. 5. Select the name of an ACL from the Name list. 6. Specify the action (i.e., Permit or Deny). 7. Select the address type (Any or IPv6-prefix). 8. If you select “Host,” enter a specific address.
Chapter 12 | Security Measures Access Control Lists Configuring Use the Security > ACL (Configure ACL - Add Rule - MAC) page to configure a MAC a MAC ACL ACL based on hardware addresses, packet format, and Ethernet type. Parameters These parameters are displayed: ◆ Type – Selects the type of ACLs to show in the Name list. ◆ Name – Shows the names of ACLs matching the selected type. ◆ Action – An ACL can contain any combination of permit or deny rules.
Chapter 12 | Security Measures Access Control Lists Web Interface To add rules to a MAC ACL: 1. Click Security, ACL. 2. Select Configure ACL from the Step list. 3. Select Add Rule from the Action list. 4. Select MAC from the Type list. 5. Select the name of an ACL from the Name list. 6. Specify the action (i.e., Permit or Deny). 7. Select the address type (Any, Host, or MAC). 8. If you select “Host,” enter a specific address (e.g., 11-22-33-44-55-66).
Chapter 12 | Security Measures Access Control Lists Configuring Use the Security > ACL (Configure ACL - Add Rule - ARP) page to configure ACLs an ARP ACL based on ARP message addresses. ARP Inspection can then use these ACLs to filter suspicious traffic (see “Configuring Global Settings for ARP Inspection” on page 333). Parameters These parameters are displayed: ◆ Type – Selects the type of ACLs to show in the Name list. ◆ Name – Shows the names of ACLs matching the selected type.
Chapter 12 | Security Measures Access Control Lists 5. Select the name of an ACL from the Name list. 6. Specify the action (i.e., Permit or Deny). 7. Select the packet type (Request, Response, All). 8. Select the address type (Any, Host, or IP). 9. If you select “Host,” enter a specific address (e.g., 11-22-33-44-55-66). If you select “IP,” enter a base address and a hexadecimal bit mask for an address range. 10. Enable logging if required. 11. Click Apply.
Chapter 12 | Security Measures Access Control Lists ◆ Time Range – Name of a time range. ◆ Counter – Enables counter for ACL statistics. Web Interface To bind an ACL to a port: 1. Click Security, ACL. 2. Select Configure Interface from the Step list. 3. Select Configure from the Action list. 4. Select IP, MAC or IPv6 from the Type options. 5. Select a port. 6. Select the name of an ACL from the ACL list. 7. Click Apply.
Chapter 12 | Security Measures Access Control Lists Configuring After configuring ACLs, use the Security > ACL (Configure Interface – Add Mirror) ACL Mirroring page to mirror traffic matching an ACL from one or more source ports to a target port for real-time analysis. You can then attach a logic analyzer or RMON probe to the target port and study the traffic crossing the source VLAN(s) in a completely unobtrusive manner. Command Usage ACL-based mirroring is only used for ingress traffic.
Chapter 12 | Security Measures Access Control Lists Figure 207: Configuring ACL Mirroring To show the ACLs to be mirrored: 1. Select Configure Interface from the Step list. 2. Select Show Mirror from the Action list. 3. Select a port. Figure 208: Showing the VLANs to Mirror Showing Use the Security > ACL > Configure Interface (Show Hardware Counters) page to ACL Hardware show statistics for ACL hardware counters. Counters Parameters These parameters are displayed: ◆ Port – Port identifier.
Chapter 12 | Security Measures ARP Inspection ◆ Time-Range – Name of a time range. ◆ Hit – Shows the number of packets matching this ACL.7 ◆ Clear Counter – Clears the hit counter for the specified ACL. Web Interface To show statistics for ACL hardware counters: 1. Click Security, ACL. 2. Select Configure Interface from the Step list. 3. Select Show Hardware Counters from the Action list. 4. Select a port. 5. Select ingress or egress traffic.
Chapter 12 | Security Measures ARP Inspection required VLANs. ARP Inspection can also validate ARP packets against userconfigured ARP access control lists (ACLs) for hosts with statically configured addresses (see “Configuring an ARP ACL” on page 327). Command Usage Enabling & Disabling ARP Inspection ◆ ARP Inspection is controlled on a global and VLAN basis. ◆ By default, ARP Inspection is disabled both globally and on all VLANs.
Chapter 12 | Security Measures ARP Inspection ■ Destination MAC – Checks the destination MAC address in the Ethernet header against the target MAC address in the ARP body. This check is performed for ARP responses. When enabled, packets with different MAC addresses are classified as invalid and are dropped. ■ IP – Checks the ARP body for invalid and unexpected IP addresses. These addresses include 0.0.0.0, 255.255.255.255, and all IP multicast addresses.
Chapter 12 | Security Measures ARP Inspection ■ Allow Zeros – Allows sender IP address to be 0.0.0.0. ■ Src-MAC – Validates the source MAC address in the Ethernet header against the sender MAC address in the ARP body. This check is performed on both ARP requests and responses. ◆ Log Message Number – The maximum number of entries saved in a log message. (Range: 0-256; Default: 5) ◆ Log Interval – The interval at which log messages are sent.
Chapter 12 | Security Measures ARP Inspection ◆ ARP Inspection ACLs can be applied to any configured VLAN. ◆ ARP Inspection uses the DHCP snooping bindings database for the list of valid IP-to-MAC address bindings. ARP ACLs take precedence over entries in the DHCP snooping bindings database. The switch first compares ARP packets to any specified ARP ACLs.
Chapter 12 | Security Measures ARP Inspection Figure 211: Configuring VLAN Settings for ARP Inspection Configuring Interface Use the Security > ARP Inspection (Configure Interface) page to specify the ports Settings for ARP that require ARP inspection, and to adjust the packet inspection rate. Inspection Parameters These parameters are displayed: ◆ Interface – Port or trunk identifier. ◆ Trust Status – Configures the port as trusted or untrusted.
Chapter 12 | Security Measures ARP Inspection Figure 212: Configuring Interface Settings for ARP Inspection Displaying Use the Security > ARP Inspection (Show Information - Show Statistics) page to ARP Inspection display statistics about the number of ARP packets processed, or dropped for Statistics various reasons.
Chapter 12 | Security Measures ARP Inspection 3. Select Show Statistics from the Action list. Figure 213: Displaying Statistics for ARP Inspection Displaying the Use the Security > ARP Inspection (Show Information - Show Log) page to show ARP Inspection Log information about entries stored in the log, including the associated VLAN, port, and address components. Parameters These parameters are displayed: Table 21: ARP Inspection Log Parameter Description VLAN ID The VLAN where this packet was seen.
Chapter 12 | Security Measures Filtering IP Addresses for Management Access Figure 214: Displaying the ARP Inspection Log Filtering IP Addresses for Management Access Use the Security > IP Filter page to create a list of up to 15 IP addresses or IP address groups that are allowed management access to the switch through the web interface, SNMP, or Telnet. Command Usage ◆ The management interfaces are open to all IP addresses by default.
Chapter 12 | Security Measures Filtering IP Addresses for Management Access ■ All – Configures IP address(es) for all groups. ◆ Start IP Address – A single IP address, or the starting address of a range. ◆ End IP Address – The end address of a range. Web Interface To create a list of IP addresses authorized for management access: 1. Click Security, IP Filter. 2. Select Add from the Action list. 3. Select the management interface to filter (Web, SNMP, Telnet, All). 4.
Chapter 12 | Security Measures Configuring Port Security Configuring Port Security Use the Security > Port Security page to configure the maximum number of device MAC addresses that can be learned by a switch port, stored in the address table, and authorized to access the network. When port security is enabled on a port, the switch stops learning new MAC addresses on the specified port when it has reached a configured maximum number.
Chapter 12 | Security Measures Configuring Port Security Parameters These parameters are displayed: ◆ Port – Port identifier. ◆ Security Status – Enables or disables port security on a port. (Default: Disabled) ◆ Port Status – The operational status: ◆ ◆ ■ Secure/Down – Port security is disabled. ■ Secure/Up – Port security is enabled. ■ Shutdown – Port is shut down due to a response to a port security violation.
Chapter 12 | Security Measures Configuring 802.1X Port Authentication Web Interface To configure port security: 1. Click Security, Port Security. 2. Mark the check box in the Security Status column to enable security, set the action to take when an invalid address is detected on a port, and set the maximum number of MAC addresses allowed on the port. 3. Click Apply. Figure 217: Configuring Port Security Configuring 802.
Chapter 12 | Security Measures Configuring 802.1X Port Authentication Security), PEAP (Protected Extensible Authentication Protocol), or TTLS (Tunneled Transport Layer Security). The client responds to the appropriate method with its credentials, such as a password or certificate. The RADIUS server verifies the client credentials and responds with an accept or reject packet. If authentication is successful, the switch allows the client to access the network.
Chapter 12 | Security Measures Configuring 802.1X Port Authentication Configuring 802.1X Use the Security > Port Authentication (Configure Global) page to configure IEEE Global Settings 802.1X port authentication. The 802.1X protocol must be enabled globally for the switch system before port settings are active. Parameters These parameters are displayed: ◆ System Authentication Control – Sets the global setting for 802.1X.
Chapter 12 | Security Measures Configuring 802.1X Port Authentication 3. Enable 802.1X globally for the switch, and configure EAPOL Pass Through if required. Then set the user name and password to use when the switch responds an MD5 challenge from the authentication server. 4. Click Apply Figure 219: Configuring Global Settings for 802.1X Port Authentication Configuring Use the Security > Port Authentication (Configure Interface – Authenticator) page Port Authenticator to configure 802.
Chapter 12 | Security Measures Configuring 802.1X Port Authentication Parameters These parameters are displayed: ◆ Port – Port number. ◆ Status – Indicates if authentication is enabled or disabled on the port. The status is disabled if the control mode is set to Force-Authorized. ◆ Authorized – Displays the 802.1X authorization status of connected clients. ◆ ◆ ■ Yes – Connected client is authorized. ■ N/A – Connected client is not authorized, or port is not connected.
Chapter 12 | Security Measures Configuring 802.1X Port Authentication ◆ Quiet Period – Sets the time that a switch port waits after the Max Request Count has been exceeded before attempting to acquire a new client. (Range: 165535 seconds; Default: 60 seconds) ◆ Tx Period – Sets the time period during an authentication session that the switch waits before re-transmitting an EAP packet.
Chapter 12 | Security Measures Configuring 802.1X Port Authentication Supplicant List ◆ Supplicant – MAC address of authorized client. Authenticator PAE State Machine ◆ State – Current state (including initialize, disconnected, connecting, authenticating, authenticated, aborting, held, force_authorized, force_unauthorized). ◆ Reauth Count – Number of times connecting state is re-entered.
Chapter 12 | Security Measures Configuring 802.1X Port Authentication Figure 220: Configuring Interface Settings for 802.1X Port Authenticator Configuring Use the Security > Port Authentication (Configure Interface – Supplicant) page to Port Supplicant configure 802.1X port settings for supplicant requests issued from a port to an Settings for 802.1X authenticator on another device. When 802.
Chapter 12 | Security Measures Configuring 802.1X Port Authentication Parameters These parameters are displayed: ◆ Port – Port number. ◆ PAE Supplicant – Enables PAE supplicant mode. (Default: Disabled) If the attached client must be authenticated through another device in the network, supplicant status must be enabled. Supplicant status can only be enabled if PAE Control Mode is set to “ForceAuthorized” on this port (see “Configuring Port Authenticator Settings for 802.1X” on page 347).
Chapter 12 | Security Measures Configuring 802.1X Port Authentication Figure 221: Configuring Interface Settings for 802.1X Port Supplicant Displaying Use the Security > Port Authentication (Show Statistics) page to display statistics for 802.1X Statistics dot1x protocol exchanges for any port. Parameters These parameters are displayed: Table 22: 802.1X Statistics Parameter Description Authenticator Rx EAPOL Start The number of EAPOL Start frames that have been received by this Authenticator.
Chapter 12 | Security Measures Configuring 802.1X Port Authentication Table 22: 802.1X Statistics (Continued) Parameter Description Tx EAP Req/Oth The number of EAP Request frames (other than Rq/Id frames) that have been transmitted by this Authenticator. Tx EAPOL Total The number of EAPOL frames of any type that have been transmitted by this Authenticator. Supplicant Rx EAPOL Invalid The number of EAPOL frames that have been received by this Supplicant in which the frame type is not recognized.
Chapter 12 | Security Measures Configuring 802.1X Port Authentication Web Interface To display port authenticator statistics for 802.1X: 1. Click Security, Port Authentication. 2. Select Show Statistics from the Step list. 3. Click Authenticator. 4. Select a port. Figure 222: Showing Statistics for 802.1X Port Authenticator To display port supplicant statistics for 802.1X: 1. Click Security, Port Authentication. 2. Select Show Statistics from the Step list. 3. Click Supplicant. 4. Select a port.
Chapter 12 | Security Measures DoS Protection Figure 223: Showing Statistics for 802.1X Port Supplicant D DoS Protection Use the Security > DoS Protection page to protect against denial-of-service (DoS) attacks. A DoS attack is an attempt to block the services provided by a computer or network resource. This kind of attack tries to prevent an Internet site or service from functioning efficiently or at all.
Chapter 12 | Security Measures DoS Protection returns ACK packets. These half-open connections will bind resources on the target, and no new connections can be made, resulting in a denial of service. (Default: Disabled) ◆ TCP Flooding Attack Rate – Maximum allowed rate. (Range: 64-2000 kbits/ second; Default: 1000 kbits/second) ◆ TCP Null Scan – A TCP NULL scan message is used to identify listening TCP ports.
Chapter 12 | Security Measures IP Source Guard patches to prevent the WinNuke attack, but the OOB packets. (Default: Disabled) ◆ WinNuke Attack Rate – Maximum allowed rate. (Range: 64-2000 kbits/second; Default: 1000 kbits/second) Web Interface To protect against DoS attacks: 1. Click Security, DoS Protection. 2. Enable protection for specific DoS attacks, and set the maximum allowed rate as required. 3.
Chapter 12 | Security Measures IP Source Guard Configuring Ports for Use the Security > IP Source Guard > Port Configuration page to set the filtering IP Source Guard type based on source IP address, or source IP address and MAC address pairs. IP Source Guard is used to filter traffic on an insecure port which receives messages from outside the network or fire wall, and therefore may be subject to traffic attacks caused by a host trying to use the IP address of a neighbor.
Chapter 12 | Security Measures IP Source Guard Parameters These parameters are displayed: ◆ ◆ Filter Type – Configures the switch to filter inbound traffic based source IP address, or source IP address and corresponding MAC address. (Default: None) ■ None – Disables IP source guard filtering on the port. ■ SIP – Enables traffic filtering based on IP addresses stored in the binding table.
Chapter 12 | Security Measures IP Source Guard Command Usage ◆ Table entries include a MAC address, IP address, lease time, entry type (Static-IPSG-Binding, Dynamic-DHCP-Binding), VLAN identifier, and port identifier. ◆ Static addresses entered in the source guard binding table are automatically configured with an infinite lease time. ◆ When source guard is enabled, traffic is filtered based upon dynamic entries learned via DHCP snooping, or static addresses configured in the source guard binding table.
Chapter 12 | Security Measures IP Source Guard ◆ Lease Time – The time for which this IP address is leased to the client. (This value is zero for all static addresses.) ◆ VLAN – VLAN to which this entry is bound. ◆ Interface – The port to which this entry is bound. Web Interface To configure static bindings for IP Source Guard: 1. Click Security, IP Source Guard, Static Configuration. 2. Select Add from the Action list. 3. Enter the required bindings for each port. 4.
Chapter 12 | Security Measures IP Source Guard Displaying Use the Security > IP Source Guard > Dynamic Binding page to display the sourceInformation for guard binding table for a selected interface. Dynamic IP Source Guard Bindings Parameters These parameters are displayed: Query by ◆ Port – A port on this switch. ◆ VLAN – ID of a configured VLAN (Range: 1-4094) ◆ MAC Address – A valid unicast MAC address. ◆ IP Address – A valid unicast IP address, including classful types A, B or C.
Chapter 12 | Security Measures DHCP Snooping Figure 228: Showing the IP Source Guard Binding Table DHCP Snooping The addresses assigned to DHCP clients on insecure ports can be carefully controlled using the dynamic bindings registered with DHCP Snooping (or using the static bindings configured with IP Source Guard). DHCP snooping allows a switch to protect a network from rogue DHCP servers or other devices which send port-related information to a DHCP server.
Chapter 12 | Security Measures DHCP Snooping ◆ Filtering rules are implemented as follows: ■ If the global DHCP snooping is disabled, all DHCP packets are forwarded. ■ If DHCP snooping is enabled globally, and also enabled on the VLAN where the DHCP packet is received, all DHCP packets are forwarded for a trusted port. If the received packet is a DHCP ACK message, a dynamic DHCP snooping entry is also added to the binding table.
Chapter 12 | Security Measures DHCP Snooping tool in preventing malicious network attacks from attached clients on DHCP services, such as IP Spoofing, Client Identifier Spoofing, MAC Address Spoofing, and Address Exhaustion. ◆ DHCP Snooping must be enabled for Option 82 information to be inserted into request packets.
Chapter 12 | Security Measures DHCP Snooping ◆ DHCP Snooping Information Option Sub-option Format – Enables or disables use of sub-type and sub-length fields in circuit-ID (CID) and remote-ID (RID) in Option 82 information. (Default: Enabled) ◆ DHCP Snooping Information Option Remote ID – Specifies the MAC address, IP address, or arbitrary identifier of the requesting device (i.e., the switch in this context).
Chapter 12 | Security Measures DHCP Snooping Figure 229: Configuring Global Settings for DHCP Snooping DHCP Snooping VLAN Use the IP Service > DHCP > Snooping (Configure VLAN) page to enable or disable Configuration DHCP snooping on specific VLANs. Command Usage ◆ When DHCP snooping is enabled globally on the switch, and enabled on the specified VLAN, DHCP packet filtering will be performed on any untrusted ports within the VLAN.
Chapter 12 | Security Measures DHCP Snooping Web Interface To configure global settings for DHCP Snooping: 1. Click IP Service, DHCP Snooping. 2. Select Configure VLAN from the Step list. 3. Enable DHCP Snooping on any existing VLAN. 4. Click Apply Figure 230: Configuring DHCP Snooping on a VLAN Configuring Ports for Use the IP Service > DHCP > Snooping (Configure Interface) page to configure DHCP Snooping switch ports as trusted or untrusted.
Chapter 12 | Security Measures DHCP Snooping ■ Value – An arbitrary string inserted into the circuit identifier field. (Range: 1-32 characters) Web Interface To configure global settings for DHCP Snooping: 1. Click IP Service, DHCP Snooping. 2. Select Configure Interface from the Step list. 3. Set any ports within the local network or firewall to trusted. 4. Specify the mode used for sending circuit ID information, and an arbitrary string if required. 5.
Chapter 12 | Security Measures DHCP Snooping ◆ VLAN – VLAN to which this entry is bound. ◆ Interface – Port or trunk to which this entry is bound. ◆ Store – Writes all dynamically learned snooping entries to flash memory. This function can be used to store the currently learned dynamic DHCP snooping entries to flash memory. These entries will be restored to the snooping table when the switch is reset.
Chapter 12 | Security Measures DHCP Snooping – 372 –
13 Basic Administration Protocols This chapter describes basic administration tasks including: ◆ Event Logging – Sets conditions for logging event messages to system memory or flash memory, configures conditions for sending trap messages to remote log servers, and configures trap reporting to remote hosts using Simple Mail Transfer Protocol (SMTP).
Chapter 13 | Basic Administration Protocols Configuring Event Logging Configuring Event Logging The switch allows you to control the logging of error messages, including the type of events that are recorded in switch memory, logging to a remote System Log (syslog) server, and displays a list of recent event messages. System Log Use the Administration > Log > System (Configure Global) page to enable or Configuration disable event logging, and specify which levels are logged to RAM or flash memory.
Chapter 13 | Basic Administration Protocols Configuring Event Logging ◆ RAM Level – Limits log messages saved to the switch’s temporary RAM memory for all levels up to the specified level. For example, if level 7 is specified, all messages from level 0 to level 7 will be logged to RAM. (Range: 0-7, Default: 7) Note: The Flash Level must be equal to or less than the RAM Level. Note: All log messages are retained in RAM and Flash after a warm restart (i.e., power is reset through the command interface).
Chapter 13 | Basic Administration Protocols Configuring Event Logging memory (RAM; i.e., memory flushed on power reset) and up to 4096 entries in permanent flash memory. Figure 234: Showing Error Messages Logged to System Memory Remote Log Use the Administration > Log > Remote page to send log messages to syslog Configuration servers or other management stations. You can also limit the event messages sent to only those messages below a specified level.
Chapter 13 | Basic Administration Protocols Configuring Event Logging ◆ Port – Specifies the UDP port number used by the remote server. (Range: 1-65535; Default: 514) Web Interface To configure the logging of error messages to remote servers: 1. Click Administration, Log, Remote. 2. Enable remote logging, specify the facility type to use for the syslog messages. and enter the IP address of the remote servers. 3. Click Apply.
Chapter 13 | Basic Administration Protocols Configuring Event Logging ◆ Email Destination Address – Specifies the email recipients of alert messages. You can specify up to five recipients. ◆ Server IP Address – Specifies a list of up to three recipient SMTP servers. IPv4 or IPv6 addresses may be specified. The switch attempts to connect to the listed servers in sequential order if the first server fails to respond.
Chapter 13 | Basic Administration Protocols Link Layer Discovery Protocol Link Layer Discovery Protocol Link Layer Discovery Protocol (LLDP) is used to discover basic information about neighboring devices on the local broadcast domain. LLDP is a Layer 2 protocol that uses periodic broadcasts to advertise information about the sending device. Advertised information is represented in Type Length Value (TLV) format according to the IEEE 802.
Chapter 13 | Basic Administration Protocols Link Layer Discovery Protocol This attribute must comply with the rule: (4 * Delay Interval) ≤ Transmission Interval ◆ Reinitialization Delay – Configures the delay before attempting to re-initialize after LLDP ports are disabled or the link goes down. (Range: 1-10 seconds; Default: 2 seconds) When LLDP is re-initialized on a port, all information in the remote systems LLDP MIB associated with this port is deleted.
Chapter 13 | Basic Administration Protocols Link Layer Discovery Protocol Figure 237: Configuring LLDP Timing Attributes Configuring Use the Administration > LLDP (Configure Interface - Configure General) page to LLDP Interface specify the message attributes for individual interfaces, including whether Attributes messages are transmitted, received, or both transmitted and received, whether SNMP notifications are sent, and the type of information advertised.
Chapter 13 | Basic Administration Protocols Link Layer Discovery Protocol ◆ Basic Optional TLVs – Configures basic information included in the TLV field of advertised messages. ■ Management Address – The management address protocol packet includes the IPv4 address of the switch. If no management address is available, the address should be the MAC address for the CPU or for the port sending this advertisement.
Chapter 13 | Basic Administration Protocols Link Layer Discovery Protocol ◆ ◆ ◆ ■ VLAN ID – The port’s default VLAN identifier (PVID) indicates the VLAN with which untagged or priority-tagged frames are associated (see “IEEE 802.1Q VLANs” on page 149). (Default: Enabled) ■ VLAN Name – The name of all VLANs to which this interface has been assigned (see “IEEE 802.1Q VLANs” on page 149).
Chapter 13 | Basic Administration Protocols Link Layer Discovery Protocol ■ Country – The two-letter ISO 3166 country code in capital ASCII letters. (Example: DK, DE or US) ■ Device entry refers to – The type of device to which the location applies: ■ Location of DHCP server. ■ Location of network element closest to client. ■ Location of client. (This is the default.) Web Interface To configure LLDP interface attributes: 1. Click Administration, LLDP. 2.
Chapter 13 | Basic Administration Protocols Link Layer Discovery Protocol Configuring Use the Administration > LLDP (Configure Interface – Add CA-Type) page to specify LLDP Interface the physical location of the device attached to an interface. Civic-Address Command Usage ◆ Use the Civic Address type (CA-Type) to advertise the physical location of the device attached to an interface, including items such as the city, street number, building and room information.
Chapter 13 | Basic Administration Protocols Link Layer Discovery Protocol 3. Select Add CA-Type from the Action list. 4. Select an interface from the Port or Trunk list. 5. Specify a CA-Type and CA-Value pair. 6. Click Apply. Figure 239: Configuring the Civic Address for an LLDP Interface To show the physical location of the attached device: 1. Click Administration, LLDP. 2. Select Configure Interface from the Step list. 3. Select Show CA-Type from the Action list. 4.
Chapter 13 | Basic Administration Protocols Link Layer Discovery Protocol Displaying LLDP Local Use the Administration > LLDP (Show Local Device Information) page to display Device Information information about the switch, such as its MAC address, chassis ID, management IP address, and port information. Parameters These parameters are displayed: General Settings ◆ Chassis Type – Identifies the chassis containing the IEEE 802 LAN entity associated with the transmitting LLDP agent.
Chapter 13 | Basic Administration Protocols Link Layer Discovery Protocol Table 26: System Capabilities (Continued) ID Basis Reference Router IETF RFC 1812 Telephone IETF RFC 2011 DOCSIS cable device IETF RFC 2669 and IETF RFC 2670 End Station Only IETF RFC 2011 ◆ System Capabilities Enabled – The primary function(s) of the system which are currently enabled. Refer to the preceding table. ◆ Management Address – The management address associated with the local system.
Chapter 13 | Basic Administration Protocols Link Layer Discovery Protocol Table 27: Port ID Subtype (Continued) ID Basis Reference Agent circuit ID agent circuit ID (IETF RFC 3046) Locally assigned locally assigned ◆ Port/Trunk ID – A string that contains the specific identifier for the local interface based on interface subtype used by this switch. ◆ Port/Trunk Description – A string that indicates the port or trunk description.
Chapter 13 | Basic Administration Protocols Link Layer Discovery Protocol Figure 242: Displaying Local Device Information for LLDP (Port) Figure 243: Displaying Local Device Information for LLDP (Port Details) Displaying LLDP Use the Administration > LLDP (Show Remote Device Information) page to display Remote Device information about devices connected directly to the switch’s ports which are Information advertising information through LLDP, or to display detailed information about an LLDP-enabled device
Chapter 13 | Basic Administration Protocols Link Layer Discovery Protocol Port Details ◆ Port – Port identifier on local switch. ◆ Remote Index – Index of remote device attached to this port. ◆ Local Port – The local port to which a remote LLDP-capable device is attached. ◆ Chassis Type – Identifies the chassis containing the IEEE 802 LAN entity associated with the transmitting LLDP agent.
Chapter 13 | Basic Administration Protocols Link Layer Discovery Protocol supports port-based protocol VLANs, and whether the port-based protocol VLANs are enabled on the given port associated with the remote system. ◆ Remote VLAN Name List – VLAN names associated with a port. ◆ Remote Protocol Identity List – Information about particular protocols that are accessible through a port.
Chapter 13 | Basic Administration Protocols Link Layer Discovery Protocol ◆ Remote Port MAU Type – An integer value that indicates the operational MAU type of the sending device. This object contains the integer value derived from the list position of the corresponding dot3MauType as listed in IETF RFC 3636 and is equal to the last number in the respective dot3MauType OID. Port Details – 802.
Chapter 13 | Basic Administration Protocols Link Layer Discovery Protocol Port Details – LLDP-MED Capability 8 ◆ ◆ ◆ Device Class – Any of the following categories of endpoint devices: ■ Class 1 – The most basic class of endpoint devices. ■ Class 2 – Endpoint devices that supports media stream capabilities. ■ Class 3 – Endpoint devices that directly supports end users of the IP communication systems.
Chapter 13 | Basic Administration Protocols Link Layer Discovery Protocol ◆ Layer 2 Priority – The Layer 2 priority to be used for the specified application type. This field may specify one of eight priority levels (0-7), where a value of 0 represents use of the default priority. ◆ Unknown Policy Flag – Indicates that an endpoint device wants to explicitly advertise that this policy is required by the device, but is currently unknown.
Chapter 13 | Basic Administration Protocols Link Layer Discovery Protocol ◆ ◆ Power Source – Shows information based on the type of device: ■ PD – Unknown, PSE, Local, PSE and Local ■ PSE – Unknown, Primary Power Source, Backup Power Source - Power conservation mode Power Value – The total power in watts required by a PD device from a PSE device, or the total power a PSE device is capable of sourcing over a maximum length cable based on its current configuration.
Chapter 13 | Basic Administration Protocols Link Layer Discovery Protocol Figure 244: Displaying Remote Device Information for LLDP (Port) – 397 –
Chapter 13 | Basic Administration Protocols Link Layer Discovery Protocol Figure 245: Displaying Remote Device Information for LLDP (Port Details) – 398 –
Chapter 13 | Basic Administration Protocols Link Layer Discovery Protocol Additional information displayed by an end-point device which advertises LLDPMED TLVs is shown in the following figure. Figure 246: Displaying Remote Device Information for LLDP (End Node) Displaying Use the Administration > LLDP (Show Device Statistics) page to display statistics for Device Statistics LLDP-capable devices attached to the switch, and for LLDP protocol messages transmitted or received on all local interfaces.
Chapter 13 | Basic Administration Protocols Link Layer Discovery Protocol ◆ Neighbor Entries Age-out Count – The number of times that a neighbor’s information has been deleted from the LLDP remote systems MIB because the remote TTL timer has expired. Port/Trunk ◆ Frames Discarded – Number of frames discarded because they did not conform to the general validation rules as well as any specific usage rules defined for the particular TLV.
Chapter 13 | Basic Administration Protocols Simple Network Management Protocol Figure 248: Displaying LLDP Device Statistics (Port) Simple Network Management Protocol Simple Network Management Protocol (SNMP) is a communication protocol designed specifically for managing devices on a network. Equipment commonly managed with SNMP includes switches, routers and host computers.
Chapter 13 | Basic Administration Protocols Simple Network Management Protocol and specified security levels. Each group also has a defined security access to set of MIB objects for reading and writing, which are known as “views.” The switch has a default view (all MIB objects) and default groups defined for security models v1 and v2c. The following table shows the security models and levels available and the system default settings.
Chapter 13 | Basic Administration Protocols Simple Network Management Protocol Configuring SNMPv3 Management Access 1. Use the Administration > SNMP (Configure Global) page to enable SNMP on the switch, and to enable trap messages. 2. Use the Administration > SNMP (Configure Trap) page to specify trap managers so that key events are reported by this switch to your management station. 3. Use the Administration > SNMP (Configure Engine) page to change the local engine ID.
Chapter 13 | Basic Administration Protocols Simple Network Management Protocol 4. Click Apply Figure 249: Configuring Global Settings for SNMP Setting the Use the Administration > SNMP (Configure Engine - Set Engine ID) page to change Local Engine ID the local engine ID. An SNMPv3 engine is an independent SNMP agent that resides on the switch. This engine protects against message replay, delay, and redirection.
Chapter 13 | Basic Administration Protocols Simple Network Management Protocol Figure 250: Configuring the Local Engine ID for SNMP Specifying a Use the Administration > SNMP (Configure Engine - Add Remote Engine) page to Remote Engine ID configure a engine ID for a remote management station. To allow management access from an SNMPv3 user on a remote device, you must first specify the engine identifier for the SNMP agent on the remote device where the user resides.
Chapter 13 | Basic Administration Protocols Simple Network Management Protocol Web Interface To configure a remote SNMP engine ID: 1. Click Administration, SNMP. 2. Select Configure Engine from the Step list. 3. Select Add Remote Engine from the Action list. 4. Enter an ID of a least 9 hexadecimal characters, and the IP address of the remote host. 5. Click Apply Figure 251: Configuring a Remote Engine ID for SNMP To show the remote SNMP engine IDs: 1. Click Administration, SNMP. 2.
Chapter 13 | Basic Administration Protocols Simple Network Management Protocol Setting SNMPv3 Views Use the Administration > SNMP (Configure View) page to configure SNMPv3 views which are used to restrict user access to specified portions of the MIB tree. The predefined view “defaultview” includes access to the entire MIB tree. Parameters These parameters are displayed: Add View ◆ View Name – The name of the SNMP view.
Chapter 13 | Basic Administration Protocols Simple Network Management Protocol Figure 253: Creating an SNMP View To show the SNMP views of the switch’s MIB database: 1. Click Administration, SNMP. 2. Select Configure View from the Step list. 3. Select Show View from the Action list. Figure 254: Showing SNMP Views To add an object identifier to an existing SNMP view of the switch’s MIB database: 1. Click Administration, SNMP. 2. Select Configure View from the Step list. 3.
Chapter 13 | Basic Administration Protocols Simple Network Management Protocol Figure 255: Adding an OID Subtree to an SNMP View To show the OID branches configured for the SNMP views of the switch’s MIB database: 1. Click Administration, SNMP. 2. Select Configure View from the Step list. 3. Select Show OID Subtree from the Action list. 4. Select a view name from the list of existing views.
Chapter 13 | Basic Administration Protocols Simple Network Management Protocol ◆ Security Level – The following security levels are only used for the groups assigned to the SNMP security model: ■ noAuthNoPriv – There is no authentication or encryption used in SNMP communications. (This is the default security level.) ■ AuthNoPriv – SNMP communications use authentication, but the data is not encrypted. ■ AuthPriv – SNMP communications use both authentication and encryption.
Chapter 13 | Basic Administration Protocols Simple Network Management Protocol Table 30: Supported Notification Messages Model Level Group newRoot 1.3.6.1.2.1.17.0.1 The newRoot trap indicates that the sending agent has become the new root of the Spanning Tree; the trap is sent by a bridge soon after its election as the new root, e.g., upon expiration of the Topology Change Timer immediately subsequent to its election. topologyChange 1.3.6.1.2.1.17.0.
Chapter 13 | Basic Administration Protocols Simple Network Management Protocol Table 30: Supported Notification Messages (Continued) Model Level Group swIpFilterRejectTrap 1.3.6.1.4.1.259.10.1.11.2.1.0.40 This trap is sent when an incorrect IP address is rejected by the IP Filter. swAtcBcastStormAlarmFireTrap 1.3.6.1.4.1.259.10.1.11.2.1.0.70 When broadcast traffic is detected as a storm, this trap is fired. swAtcBcastStormAlarmClearTrap 1.3.6.1.4.1.259.10.1.11.2.1.0.
Chapter 13 | Basic Administration Protocols Simple Network Management Protocol Table 30: Supported Notification Messages (Continued) Model Level Group swMemoryUtiRisingThreshold Notification 1.3.6.1.4.1.259.10.1.11.2.1.0.109 This notification indicates that the memory utilization has risen from memoryUtiFallingThreshold to memoryUtiRisingThreshold. swMemoryUtiFallingThreshold Notification 1.3.6.1.4.1.259.10.1.11.2.1.0.
Chapter 13 | Basic Administration Protocols Simple Network Management Protocol Web Interface To configure an SNMP group: 1. Click Administration, SNMP. 2. Select Configure Group from the Step list. 3. Select Add from the Action list. 4. Enter a group name, assign a security model and level, and then select read, write, and notify views. 5. Click Apply Figure 257: Creating an SNMP Group To show SNMP groups: 1. Click Administration, SNMP. 2. Select Configure Group from the Step list. 3.
Chapter 13 | Basic Administration Protocols Simple Network Management Protocol Figure 258: Showing SNMP Groups Setting Community Use the Administration > SNMP (Configure User - Add Community) page to Access Strings configure up to five community strings authorized for management access by clients using SNMP v1 and v2c. For security reasons, you should consider removing the default strings.
Chapter 13 | Basic Administration Protocols Simple Network Management Protocol Web Interface To set a community access string: 1. Click Administration, SNMP. 2. Select Configure User from the Step list. 3. Select Add Community from the Action list. 4. Add new community strings as required, and select the corresponding access rights from the Access Mode list. 5. Click Apply Figure 259: Setting Community Access Strings To show the community access strings: 1. Click Administration, SNMP. 2.
Chapter 13 | Basic Administration Protocols Simple Network Management Protocol Configuring Local Use the Administration > SNMP (Configure User - Add SNMPv3 Local User) page to SNMPv3 Users authorize management access for SNMPv3 clients, or to identify the source of SNMPv3 trap messages sent from the local switch. Each SNMPv3 user is defined by a unique name. Users must be configured with a specific security level and assigned to a group.
Chapter 13 | Basic Administration Protocols Simple Network Management Protocol Web Interface To configure a local SNMPv3 user: 1. Click Administration, SNMP. 2. Select Configure User from the Step list. 3. Select Add SNMPv3 Local User from the Action list. 4. Enter a name and assign it to a group. If the security model is set to SNMPv3 and the security level is authNoPriv or authPriv, then an authentication protocol and password must be specified.
Chapter 13 | Basic Administration Protocols Simple Network Management Protocol Figure 262: Showing Local SNMPv3 Users To change a local SNMPv3 local user group: 1. Click Administration, SNMP. 2. Select Change SNMPv3 Local User Group from the Action list. 3. Select the User Name. 4. Enter a new group name. 5.
Chapter 13 | Basic Administration Protocols Simple Network Management Protocol Parameters These parameters are displayed: ◆ User Name – The name of user connecting to the SNMP agent. (Range: 1-32 characters) ◆ Group Name – The name of the SNMP group to which the user is assigned. (Range: 1-32 characters) ◆ Remote IP – The IPv4 or IPv6 address of the remote device where the user resides. ◆ Security Model – The user security model; SNMP v1, v2c or v3.
Chapter 13 | Basic Administration Protocols Simple Network Management Protocol authentication protocol and password must be specified. If the security level is authPriv, a privacy password must also be specified. 5. Click Apply Figure 264: Configuring Remote SNMPv3 Users To show remote SNMPv3 users: 1. Click Administration, SNMP. 2. Select Configure User from the Step list. 3. Select Show SNMPv3 Remote User from the Action list.
Chapter 13 | Basic Administration Protocols Simple Network Management Protocol Specifying Use the Administration > SNMP (Configure Trap) page to specify the host devices to Trap Managers be sent traps and the types of traps to send. Traps indicating status changes are issued by the switch to the specified trap managers. You must specify trap managers so that key events are reported by this switch to your management station (using network management software).
Chapter 13 | Basic Administration Protocols Simple Network Management Protocol ◆ Community String – Specifies a valid community string for the new trap manager entry. (Range: 1-32 characters, case sensitive) Although you can set this string in the Configure Trap – Add page, we recommend defining it in the Configure User – Add Community page. ◆ UDP Port – Specifies the UDP port number used by the trap manager.
Chapter 13 | Basic Administration Protocols Simple Network Management Protocol ■ ◆ Inform – Notifications are sent as inform messages. Note that this option is only available for version 2c and 3 hosts. (Default: traps are used) ■ Timeout – The number of seconds to wait for an acknowledgment before resending an inform message.
Chapter 13 | Basic Administration Protocols Simple Network Management Protocol 5.
Chapter 13 | Basic Administration Protocols Simple Network Management Protocol To show configured trap managers: 1. Click Administration, SNMP. 2. Select Configure Trap from the Step list. 3. Select Show from the Action list. Figure 269: Showing Trap Managers Creating SNMP Use the Administration > SNMP (Configure Notify Filter - Add) page to create an Notification Logs SNMP notification log.
Chapter 13 | Basic Administration Protocols Simple Network Management Protocol ◆ When a trap host is created using the Administration > SNMP (Configure Trap – Add) page described on page 422, a default notify filter will be created. Parameters These parameters are displayed: ◆ IP Address – The IPv4 or IPv6 address of a remote device. The specified target host must already have been configured using the Administration > SNMP (Configure Trap – Add) page. The notification log is stored locally.
Chapter 13 | Basic Administration Protocols Simple Network Management Protocol Figure 271: Showing SNMP Notification Logs Showing Use the Administration > SNMP (Show Statistics) page to show counters for SNMP SNMP Statistics input and output protocol data units. Parameters The following counters are displayed: ◆ SNMP packets input – The total number of messages delivered to the SNMP entity from the transport service.
Chapter 13 | Basic Administration Protocols Simple Network Management Protocol ◆ SNMP packets output – The total number of SNMP Messages which were passed from the SNMP protocol entity to the transport service. ◆ Too big errors – The total number of SNMP PDUs which were generated by the SNMP protocol entity and for which the value of the error-status field is “tooBig.
Chapter 13 | Basic Administration Protocols Remote Monitoring Remote Monitoring Remote Monitoring allows a remote device to collect information or respond to specified events on an independent basis. This switch is an RMON-capable device which can independently perform a wide range of tasks, significantly reducing network management traffic. It can continuously run diagnostics and log information on network performance.
Chapter 13 | Basic Administration Protocols Remote Monitoring ◆ Sample Type – Tests for absolute or relative changes in the specified variable. ■ Absolute – The variable is compared directly to the thresholds at the end of the sampling period. ■ Delta – The last sample is subtracted from the current value and the difference is then compared to the thresholds.
Chapter 13 | Basic Administration Protocols Remote Monitoring Figure 273: Configuring an RMON Alarm To show configured RMON alarms: 1. Click Administration, RMON. 2. Select Configure Global from the Step list. 3. Select Show from the Action list. 4. Click Alarm.
Chapter 13 | Basic Administration Protocols Remote Monitoring Configuring Use the Administration > RMON (Configure Global - Add - Event) page to set the RMON Events action to take when an alarm is triggered. The response can include logging the alarm or sending a message to a trap manager. Alarms and corresponding events provide a way of immediately responding to critical network problems. Command Usage ◆ If an alarm is already defined for an index, the entry must be deleted before any changes can be made.
Chapter 13 | Basic Administration Protocols Remote Monitoring Web Interface To configure an RMON event: 1. Click Administration, RMON. 2. Select Configure Global from the Step list. 3. Select Add from the Action list. 4. Click Event. 5. Enter an index number, the type of event to initiate, the community string to send with trap messages, the name of the person who created this event, and a brief description of the event. 6.
Chapter 13 | Basic Administration Protocols Remote Monitoring Figure 276: Showing Configured RMON Events Configuring RMON Use the Administration > RMON (Configure Interface - Add - History) page to collect History Samples statistics on a physical interface to monitor network utilization, packet types, and errors. A historical record of activity can be used to track down intermittent problems.
Chapter 13 | Basic Administration Protocols Remote Monitoring ◆ Interval - The polling interval. (Range: 1-3600 seconds; Default: 1800 seconds) ◆ Buckets - The number of buckets requested for this entry. (Range: 1-65536; Default: 8) The number of buckets granted are displayed on the Show page. ◆ Owner - Name of the person who created this entry. (Range: 1-32 characters) Web Interface To periodically sample statistics on a port: 1. Click Administration, RMON. 2.
Chapter 13 | Basic Administration Protocols Remote Monitoring 4. Select a port from the list. 5. Click History. Figure 278: Showing Configured RMON History Samples To show collected RMON history samples: 1. Click Administration, RMON. 2. Select Configure Interface from the Step list. 3. Select Show Details from the Action list. 4. Select a port from the list. 5. Click History.
Chapter 13 | Basic Administration Protocols Remote Monitoring Configuring RMON Use the Administration > RMON (Configure Interface - Add - Statistics) page to Statistical Samples collect statistics on a port, which can subsequently be used to monitor the network for common errors and overall traffic rates. Command Usage ◆ If statistics collection is already enabled on an interface, the entry must be deleted before any changes can be made.
Chapter 13 | Basic Administration Protocols Remote Monitoring Figure 280: Configuring an RMON Statistical Sample To show configured RMON statistical samples: 1. Click Administration, RMON. 2. Select Configure Interface from the Step list. 3. Select Show from the Action list. 4. Select a port from the list. 5. Click Statistics. Figure 281: Showing Configured RMON Statistical Samples To show collected RMON statistical samples: 1. Click Administration, RMON. 2.
Chapter 13 | Basic Administration Protocols Switch Clustering Figure 282: Showing Collected RMON Statistical Samples Switch Clustering Switch clustering is a method of grouping switches together to enable centralized management through a single unit. Switches that support clustering can be grouped together regardless of physical location or switch type, as long as they are connected to the same local network.
Chapter 13 | Basic Administration Protocols Switch Clustering ◆ The cluster VLAN 4093 is not configured by default. Before using clustering, take the following actions to set up this VLAN: 1.Create VLAN 4093 (see “Configuring VLAN Groups” on page 152). 2.Add the participating ports to this VLAN (see “Adding Static Members to VLANs” on page 155), and set them to hybrid mode, tagged members, PVID = 1, and acceptable frame type = all.
Chapter 13 | Basic Administration Protocols Switch Clustering Web Interface To configure a switch cluster: 1. Click Administration, Cluster. 2. Select Configure Global from the Step list. 3. Set the required attributes for a Commander or a managed candidate. 4. Click Apply Figure 283: Configuring a Switch Cluster Cluster Member Use the Administration > Cluster (Configure Member - Add) page to add Candidate Configuration switches to the cluster as Members.
Chapter 13 | Basic Administration Protocols Switch Clustering Web Interface To configure cluster members: 1. Click Administration, Cluster. 2. Select Configure Member from the Step list. 3. Select Add from the Action list. 4. Select one of the cluster candidates discovered by this switch, or enter the MAC address of a candidate. 5. Click Apply. Figure 284: Configuring a Cluster Members To show the cluster members: 1. Click Administration, Cluster. 2. Select Configure Member from the Step list. 3.
Chapter 13 | Basic Administration Protocols Switch Clustering 3. Select Show Candidate from the Action list. Figure 286: Showing Cluster Candidates Managing Use the Administration > Cluster (Show Member) page to manage another switch Cluster Members in the cluster. Parameters These parameters are displayed: ◆ Member ID – The ID number of the Member switch. (Range: 1-36) ◆ Role – Indicates the current status of the switch in the cluster.
Chapter 13 | Basic Administration Protocols Ethernet Ring Protection Switching Web Interface To manage a cluster member: 1. Click Administration, Cluster. 2. Select Show Member from the Step list. 3. Select an entry from the Cluster Member List. 4. Click Operate. Figure 287: Managing a Cluster Member Ethernet Ring Protection Switching Note: Information in this section is based on ITU-T G.8032/Y.1344. The ITU G.
Chapter 13 | Basic Administration Protocols Ethernet Ring Protection Switching Operational Concept Loop avoidance in the ring is achieved by guaranteeing that, at any time, traffic may flow on all but one of the ring links. This particular link is called the ring protection link (RPL), and under normal conditions this link is blocked to traffic. One designated node, the RPL owner, is responsible for blocking traffic over the RPL.
Chapter 13 | Basic Administration Protocols Ethernet Ring Protection Switching Figure 288: ERPS Ring Components West Port East Port RPL (Idle State) CC Messages x RPL Owner CC Messages Multi-ring/Ladder Network – ERPSv2 also supports multipoint-to-multipoint connectivity within interconnected rings, called a “multi-ring/ladder network” topology.
Chapter 13 | Basic Administration Protocols Ethernet Ring Protection Switching corresponding to the traffic channel may be transferred over a common Ethernet connection for ERP1 and ERP2 through the interconnection nodes C and D. Interconnection nodes C and D have separate ERP Control Processes for each Ethernet Ring. Figure 289 on page 448 (Signal Fail Condition) illustrates a situation where protection switching has occurred due to an SF condition on the ring link between interconnection nodes C and D.
Chapter 13 | Basic Administration Protocols Ethernet Ring Protection Switching Hold-off timer to filter out intermittent link faults, and the WTR timer to verify that the ring has stabilized before blocking the RPL after recovery from a signal failure. 5. Configure the ERPS Control VLAN (Configure Domain – Configure Details): Specify the Control VLAN (CVLAN) used to pass R-APS ring maintenance commands. The CVLAN must NOT be configured with an IP address.
Chapter 13 | Basic Administration Protocols Ethernet Ring Protection Switching ◆ One VLAN must be added to an ERPS domain as the CVLAN. This can be designated as any VLAN, other than the management VLAN. The CVLAN should only contain ring ports, and must not be configured with an IP address. ERPS Global Use the Administration > ERPS (Configure Global) page to globally enable or Configuration disable ERPS on the switch. Parameters These parameters are displayed: ◆ ERPS Status – Enables ERPS on the switch.
Chapter 13 | Basic Administration Protocols Ethernet Ring Protection Switching Limitations When configuring a ring port, note that these ports cannot be part of a spanning tree, nor can they be members of a static or dynamic trunk. Parameters These parameters are displayed: Add ◆ Domain Name – Name of an ERPS ring. (Range: 1-12 characters) ◆ Domain ID – ERPS ring identifier used in R-APS messages. (Range: 1-255) Show ◆ Domain Name – Name of a configured ERPS ring.
Chapter 13 | Basic Administration Protocols Ethernet Ring Protection Switching ◆ Port State – The operational state: ■ Blocking – The transmission and reception of traffic is blocked and the forwarding of R-APS messages is blocked, but the transmission of locally generated R-APS messages is allowed and the reception of all R-APS messages is allowed. ■ Forwarding – The transmission and reception of traffic is allowed; transmission, reception and forwarding of R-APS messages is allowed.
Chapter 13 | Basic Administration Protocols Ethernet Ring Protection Switching In addition to the basic features provided by version 1, version 2 also supports: ■ Multi-ring/ladder network support ■ Revertive/Non-revertive recovery ■ Forced Switch (FS) and Manual Switch (MS) commands for manually blocking a particular ring port ■ Flush FDB (forwarding database) logic which reduces amount of flush FDB operations in the ring ■ Support of multiple ERP instances on a single ring Version 2 is backward
Chapter 13 | Basic Administration Protocols Ethernet Ring Protection Switching Once the ring has been activated, the configuration of the control VLAN cannot be modified. Use the Admin Status parameter to stop the ERPS ring before making any configuration changes to the control VLAN. ◆ Node State – Refer to the parameters for the Show page. ◆ Node Type – Shows ERPS node type as one of the following: ■ None – Node is neither Ring Protection Link (RPL) owner nor neighbor. (This is the default setting.
Chapter 13 | Basic Administration Protocols Ethernet Ring Protection Switching Non-revertive behavior for Protection, Forced Switch (FS), and Manual Switch (MS) states are basically the same. Non-revertive behavior requires the RPL to be restored from Protection state to Idle state using the Clear command (Configure Operation page).
Chapter 13 | Basic Administration Protocols Ethernet Ring Protection Switching a. The RPL Owner Node does not generate a response on reception of an R-APS (NR) messages. b. When other healthy ring nodes receive the NR (Node ID) message, no action is taken in response to the message. c.
Chapter 13 | Basic Administration Protocols Ethernet Ring Protection Switching the ring port which was blocked as a result of an operator command. ■ Recovery with non-revertive mode is handled as follows: a. The RPL Owner Node, upon reception of an R-APS(NR) message and in the absence of any other higher priority request does not perform any action. b.
Chapter 13 | Basic Administration Protocols Ethernet Ring Protection Switching request, starts the WTB timer and waits for it to expire. While the WTB timer is running, any latent R-APS (MS) message is ignored due to the higher priority of the WTB running signal. b. When the WTB timer expires, it generates the WTB expire signal.
Chapter 13 | Basic Administration Protocols Ethernet Ring Protection Switching The ring node identifier is used to identify a node in R-APS messages for both automatic and manual switching recovery operations. For example, a node that has one ring port in SF condition and detects that the condition has been cleared, will continuously transmit R-APS (NR) messages with its own Node ID as priority information over both ring ports, informing its neighbors that no request is present at this node.
Chapter 13 | Basic Administration Protocols Ethernet Ring Protection Switching Figure 291: Sub-ring with Virtual Channel RPL Port Interconnection Node Sub-ring with Virtual Channel Ring Node Major Ring Virtual Channel ■ Sub-ring without R-APS Virtual Channel – Under certain circumstances it may not be desirable to use a virtual channel to interconnect the sub-ring over an arbitrary Ethernet network. In this situation, the R-APS messages are terminated on the interconnection points.
Chapter 13 | Basic Administration Protocols Ethernet Ring Protection Switching If this command is disabled, the following strings are used as the node identifier: ◆ ■ ERPSv1: 01-19-A7-00-00-01 ■ ERPSv2: 01-19-A7-00-00-[Ring ID] Propagate TC – Enables propagation of topology change messages from a secondary ring to the primary ring. (Default: Disabled) When a secondary ring detects a topology change, it can pass a message about this event to the major ring.
Chapter 13 | Basic Administration Protocols Ethernet Ring Protection Switching ■ When non-ERPS device protection is enabled on an RPL owner node, it will send non-standard health-check packets to poll the ring health when it enters the protection state. It does not use the normal procedure of waiting to receive an R-APS (NR - no request) message from nodes adjacent to the recovered link. Instead, it waits to see if the non-standard health-check packets loop back.
Chapter 13 | Basic Administration Protocols Ethernet Ring Protection Switching This is enough time to allow a reporting ring node to transmit two R-APS messages and allow the ring to identify the latent condition. This delay timer is activated on the RPL owner node. When the relevant delay timer expires, the RPL owner node initiates the reversion process by transmitting an R-APS (NR, RB) message. The delay timer, (i.e., WTR or WTB) is deactivated when any higher priority request preempts this delay timer.
Chapter 13 | Basic Administration Protocols Ethernet Ring Protection Switching ◆ Local FS – Shows if a forced switch command was issued on this interface. ◆ Local MS – Shows if a manual switch command was issued on this interface. ◆ MEP – Specifies the CCM MEPs used to monitor the link on a ring node.
Chapter 13 | Basic Administration Protocols Ethernet Ring Protection Switching To configure the ERPS parameters for a ring: 1. Click Administration, ERPS. 2. Select Configure Domain from the Step list. 3. Select Configure Details from the Action list. 4. Configure the ERPS parameters for this node. Note that spanning tree protocol cannot be configured on the ring ports, nor can these ports be members of a static or dynamic trunk. And the control VLAN must be unique for each ring.
Chapter 13 | Basic Administration Protocols Ethernet Ring Protection Switching To show the configured ERPS rings: 1. Click Administration, ERPS. 2. Select Configure Domain from the Step list. 3. Select Show from the Action list. Figure 296: Showing Configured ERPS Rings ERPS Forced and Use the Administration > ERPS (Configure Operation) page to block a ring port Manual Mode using Forced Switch or Manual Switch commands.
Chapter 13 | Basic Administration Protocols Ethernet Ring Protection Switching c. A ring node accepting an R-APS (FS) message, without any local higher priority requests unblocks any blocked ring port. This action subsequently unblocks the traffic channel over the RPL. d. The ring node accepting an R-APS (FS) message, without any local higher priority requests stops transmission of R-APS messages. e. The ring node receiving an R-APS (FS) message flushes its FDB.
Chapter 13 | Basic Administration Protocols Ethernet Ring Protection Switching Table 31: ERPS Request/State Priority (Continued) Request / State and Status Type R-APS (NR, RB) remote R-APS (NR) remote * ■ ■ Priority | lowest If an Ethernet Ring Node is in the Forced Switch state, local SF is ignored. Recovery for forced switching under revertive and nonrevertive mode is described under the Revertive parameter.
Chapter 13 | Basic Administration Protocols Ethernet Ring Protection Switching not have an SF condition. This action subsequently unblocks the traffic channel over the RPL. e. A ring node accepting an R-APS (MS) message, without any local higher priority requests stops transmitting R-APS messages. f. A ring node receiving an R-APS (MS) message flushes its FDB. ■ Protection switching on a manual switch request is completed when the above actions are performed by each ring node.
Chapter 13 | Basic Administration Protocols Connectivity Fault Management ■ More detailed information about using this command for nonrevertive mode is included under the Revertive parameter. (See the Command Usage section under “ERPS Ring Configuration” on page 450.) Web Interface To block a ring port: 1. Click Administration, ERPS. 2. Select Configure Domain from the Step list. 3. Select Configure Operation from the Action list. 4. Select the domain name from the drop-down list. 5.
Chapter 13 | Basic Administration Protocols Connectivity Fault Management association) against those found through continuity check messages. Fault verification is supported using loop back messages, and fault isolation with link trace messages. Fault notification is also provided by SNMP alarms which are automatically generated by maintenance points when connectivity faults or configuration errors are detected in the local maintenance domain.
Chapter 13 | Basic Administration Protocols Connectivity Fault Management The following figure shows a single Maintenance Domain, with DSAPs located on the domain boundary, and Internal Service Access Points (ISAPs) inside the domain through which frames may pass between the DSAPs. Figure 298: Single CFM Maintenance Domain Maintenance Domain Bridge DSAP ISAP The figure below shows four maintenance associations contained within a hierarchical structure of maintenance domains.
Chapter 13 | Basic Administration Protocols Connectivity Fault Management Basic CFM Operations CFM uses standard Ethernet frames for sending protocol messages. Both the source and destination address for these messages are based on unicast or multicast MAC addresses, and therefore confined to a single Layer 2 CFM service VLAN. For this reason, the transmission, forwarding, and processing of CFM frames is performed by bridges, not routers.
Chapter 13 | Basic Administration Protocols Connectivity Fault Management 4. Enter a static list of MEPs assigned to other devices within the same maintenance association using the Remote MEP List (see "Configuring Remote Maintenance End Points"). This allows CFM to automatically verify the functionality of these remote end points by cross-checking the static list configured on this device against information learned through continuity check messages. 5.
Chapter 13 | Basic Administration Protocols Connectivity Fault Management ◆ MEP Cross Check Start Delay – Sets the maximum delay that a device waits for remote MEPs to come up before starting the cross-check operation.
Chapter 13 | Basic Administration Protocols Connectivity Fault Management ◆ Connectivity Check Loop – Sends a trap if this device receives a CCM with the same source MAC address and MPID as its own, indicating that a forwarding loop exists. ◆ Connectivity Check MEP Down – Sends a trap if this device loses connectivity with a remote maintenance end point (MEP), or connectivity has been restored to a remote MEP which has recovered from an error condition.
Chapter 13 | Basic Administration Protocols Connectivity Fault Management 5. Enable the required traps for continuity check and cross-check errors. Remember that the “Connectivity Check” and “Cross Check” fields on the MA Configuration page must be enabled before related errors can be generated. 6. Click Apply. Figure 300: Configuring Global Settings for CFM Configuring Interfaces CFM processes are enabled by default for all physical interfaces, both ports and for CFM trunks.
Chapter 13 | Basic Administration Protocols Connectivity Fault Management Web Interface To enable CFM on an interface: 1. Click Administration, CFM. 2. Select Configure Interface from the Step list. 3. Select Port or Trunk. 4. Enable CFM on the required interface. 5. Click Apply.
Chapter 13 | Basic Administration Protocols Connectivity Fault Management Maintenance domains are designed to provide a transparent method of verifying and resolving connectivity problems for end-to-end connections. By default, these connections run between the domain service access points (DSAPs) within each MA defined for a domain, and are manually configured (see "Configuring Maintenance End Points").
Chapter 13 | Basic Administration Protocols Connectivity Fault Management Priority levels include the following options: Table 32: Remote MEP Priority Levels Priority Level Level Name Description 1 allDef All defects. 2 macRemErrXcon DefMACstatus, DefRemoteCCM, DefErrorCCM, or DefXconCCM. 3 remErrXcon DefErrorCCM, DefXconCCM or DefRemoteCCM. 4 errXcon DefErrorCCM or DefXconCCM. 5 xcon DefXconCCM 6 noXcon No defects DefXconCCM or lower are to be reported.
Chapter 13 | Basic Administration Protocols Connectivity Fault Management Configuring Detailed Settings for a Maintenance Domain ◆ MD Index – Domain index. (Range: 1-65535) ◆ MEP Archive Hold Time – The time that data from a missing MEP is retained in the continuity check message (CCM) database before being purged. (Range: 165535 minutes; Default: 100 minutes) A change to the hold time only applies to entries stored in the database after this attribute is changed.
Chapter 13 | Basic Administration Protocols Connectivity Fault Management To show the configured maintenance domains: 1. Click Administration, CFM. 2. Select Configure MD from the Step list. 3. Select Show from the Action list. Figure 303: Showing Maintenance Domains To configure detailed settings for maintenance domains: 1. Click Administration, CFM. 2. Select Configure MD from the Step list. 3. Select Configure Details from the Action list. 4. Select an entry from the MD Index. 5.
Chapter 13 | Basic Administration Protocols Connectivity Fault Management Configuring Use the Administration > CFM (Configure MA) pages to create and configure the CFM Maintenance Maintenance Associations (MA) which define a unique CFM service instance. Each Associations MA can be identified by its parent MD, the MD’s maintenance level, the VLAN assigned to the MA, and the set of maintenance end points (MEPs) assigned to it.
Chapter 13 | Basic Administration Protocols Connectivity Fault Management Parameters These parameters are displayed: Creating a Maintenance Association ◆ MD Index – Domain index. (Range: 1-65535) ◆ MA Index – MA identifier. (Range: 1-2147483647) ◆ MA Name – MA name. (Range: 1-4313 alphanumeric characters) Each MA name must be unique within the CFM domain. ◆ Primary VLAN – Service VLAN ID. (Range: 1-4094) This is the VLAN through which all CFM functions are executed for this MA.
Chapter 13 | Basic Administration Protocols Connectivity Fault Management Before starting the cross-check process, first configure the remote MEPs that exist on other devices inside the maintenance association using the Remote MEP List (see "Configuring Remote Maintenance End Points"). These remote MEPs are used in the cross-check operation to verify that all endpoints in the specified MA are operational.
Chapter 13 | Basic Administration Protocols Connectivity Fault Management Figure 305: Creating Maintenance Associations To show the configured maintenance associations: 1. Click Administration, CFM. 2. Select Configure MA from the Step list. 3. Select Show from the Action list. 4. Select an entry from the MD Index list. Figure 306: Showing Maintenance Associations To configure detailed settings for maintenance associations: 1. Click Administration, CFM. 2. Select Configure MA from the Step list. 3.
Chapter 13 | Basic Administration Protocols Connectivity Fault Management Figure 307: Configuring Detailed Settings for Maintenance Associations Configuring Use the Administration > CFM (Configure MEP – Add) page to configure Maintenance Maintenance End Points (MEPs). MEPs, also called Domain Service Access Points End Points (DSAPs), must be configured at the domain boundary to provide management access for each maintenance association.
Chapter 13 | Basic Administration Protocols Connectivity Fault Management not selected, then the MEP is facing away from the switch, and transmits CFM messages towards, and receives them from, the direction of the physical medium. ◆ Interface – Indicates a port or trunk. Web Interface To configure a maintenance end point: 1. Click Administration, CFM. 2. Select Configure MEP from the Step list. 3. Select Add from the Action list. 4. Select an entry from MD Index and MA Index. 5.
Chapter 13 | Basic Administration Protocols Connectivity Fault Management Figure 309: Showing Maintenance End Points Configuring Remote Use the Administration > CFM (Configure Remote MEP – Add) page to specify Maintenance remote maintenance end points (MEPs) set on other CFM-enabled devices within a End Points common MA. Remote MEPs can be added to a static list in this manner to verify that each entry has been properly configured and is operational.
Chapter 13 | Basic Administration Protocols Connectivity Fault Management Web Interface To configure a remote maintenance end point: 1. Click Administration, CFM. 2. Select Configure Remote MEP from the Step list. 3. Select Add from the Action list. 4. Select an entry from MD Index and MA Index. 5. Specify the remote MEPs which exist on other devices within the same MA. 6. Click Apply. Figure 310: Configuring Remote Maintenance End Points To show the configured remote maintenance end points: 1.
Chapter 13 | Basic Administration Protocols Connectivity Fault Management Transmitting Use the Administration > CFM (Transmit Link Trace) page to transmit link trace Link Trace Messages messages (LTMs). These messages can isolate connectivity faults by tracing the path through a network to the designated target node (i.e., a remote maintenance end point). Command Usage ◆ LTMs can be targeted to MEPs, not MIPs.
Chapter 13 | Basic Administration Protocols Connectivity Fault Management ■ ◆ MAC Address – MAC address of a remote MEP that is the target of a link trace message. This address can be entered in either of the following formats: xx-xx-xx-xx-xx-xx or xxxxxxxxxxxx TTL – The time to live of the link trace message. (Range: 0-255 hops) Web Interface To transmit link trace messages: 1. Click Administration, CFM. 2. Select Transmit Link Trace from the Step list. 3. Select an entry from MD Index and MA Index.
Chapter 13 | Basic Administration Protocols Connectivity Fault Management connectivity. The receiving maintenance point should respond to the loop back message with a loopback reply. ◆ The point from which the loopback message is transmitted (i.e., a local DSAP) and the target maintenance point must be within the same MA. ◆ If the continuity check database does not have an entry for the specified maintenance point, an error message will be displayed.
Chapter 13 | Basic Administration Protocols Connectivity Fault Management Figure 313: Transmitting Loopback Messages Transmitting Use the Administration > CFM (Transmit Delay Measure) page to send periodic Delay-Measure delay-measure requests to a specified MEP within a maintenance association. Requests Command Usage ◆ Delay measurement can be used to measure frame delay and frame delay variation between MEPs. ◆ A local MEP must be configured for the same MA before you can use this function.
Chapter 13 | Basic Administration Protocols Connectivity Fault Management Parameters These parameters are displayed: ◆ MD Index – Domain index. (Range: 1-65535) ◆ MA Index – MA identifier. (Range: 1-2147483647) ◆ Source MEP ID – The identifier of a source MEP that will send the delaymeasure message. (Range: 1-8191) ◆ Target ■ MEP ID – The identifier of a remote MEP that is the target of a delaymeasure message.
Chapter 13 | Basic Administration Protocols Connectivity Fault Management Figure 314: Transmitting Delay-Measure Messages Displaying Local MEPs Use the Administration > CFM > Show Information (Show Local MEP) page to show information for the MEPs configured on this device. Parameters These parameters are displayed: ◆ MEP ID – Maintenance end point identifier. ◆ MD Name – Maintenance domain name. ◆ Level – Authorized maintenance level for this domain.
Chapter 13 | Basic Administration Protocols Connectivity Fault Management ◆ MAC Address – MAC address of this MEP entry. Web Interface To show information for the MEPs configured on this device: 1. Click Administration, CFM. 2. Select Show Information from the Step list. 3. Select Show Local MEP from the Action list.
Chapter 13 | Basic Administration Protocols Connectivity Fault Management ◆ MAC Address – MAC address of the local maintenance point. (If a CCM for the specified remote MEP has never been received or the local MEP record times out, the address will be set to the initial value of all Fs.) ◆ Defect Condition – Shows the defect detected on the MEP. ◆ Received RDI – Receive status of remote defect indication (RDI) messages on the MEP.
Chapter 13 | Basic Administration Protocols Connectivity Fault Management Figure 316: Showing Detailed Information on Local MEPs Displaying Local MIPs Use the Administration > CFM > Show Information (Show Local MIP) page to show the MIPs on this device discovered by the CFM protocol. (For a description of MIPs, refer to the Command Usage section under "Configuring CFM Maintenance Domains".) Parameters These parameters are displayed: ◆ MD Name – Maintenance domain name.
Chapter 13 | Basic Administration Protocols Connectivity Fault Management 1. Click Administration, CFM. 2. Select Show Information from the Step list. 3. Select Show Local MIP from the Action list.
Chapter 13 | Basic Administration Protocols Connectivity Fault Management 3. Select Show Remote MEP from the Action list. Figure 318: Showing Information on Remote MEPs Displaying Details for Use the Administration > CFM > Show Information (Show Remote MEP Details) Remote MEPs page to show detailed information for MEPs located on other devices which have been discovered through continuity check messages, or statically configured in the MEP database and verified through cross-check messages.
Chapter 13 | Basic Administration Protocols Connectivity Fault Management ◆ ◆ ◆ Port State – Port states include: ■ Up – The port is functioning normally. ■ Blocked – The port has been blocked by the Spanning Tree Protocol. ■ No port state – Either no CCM has been received, or nor port status TLV was received in the last CCM. Interface State – Interface states include: ■ No Status – Either no CCM has been received, or no interface status TLV was received in the last CCM.
Chapter 13 | Basic Administration Protocols Connectivity Fault Management Figure 319: Showing Detailed Information on Remote MEPs Displaying the Use the Administration > CFM > Show Information (Show Link Trace Cache) page to Link Trace Cache show information about link trace operations launched from this device. Parameters These parameters are displayed: ◆ Hops – The number hops taken to reach the target MEP. ◆ MA – Maintenance association name.
Chapter 13 | Basic Administration Protocols Connectivity Fault Management has another Down MEP at a higher MD level on the same bridge port that is causing the bridge port’s MAC_Operational parameter to be false. ◆ ◆ ■ IngBlocked – The ingress port can be identified, but the target data frame was not forwarded when received on this port due to active topology management, i.e., the bridge port is not in the forwarding state.
Chapter 13 | Basic Administration Protocols Connectivity Fault Management Displaying Use the Administration > CFM > Show Information (Show Fault Notification Fault Notification Generator) page to display configuration settings for the fault notification Settings generator. Parameters These parameters are displayed: ◆ MEP ID – Maintenance end point identifier. ◆ MD Name – Maintenance domain name. ◆ MA Name – Maintenance association name.
Chapter 13 | Basic Administration Protocols Connectivity Fault Management Displaying Continuity Use the Administration > CFM > Show Information (Show Continuity Check Error) Check Errors page to display the CFM continuity check errors logged on this device. Parameters These parameters are displayed: ◆ Level – Maintenance level associated with this entry. ◆ Primary VLAN – VLAN in which this error occurred. ◆ MEP ID – Identifier of remote MEP. ◆ Interface – Port at which the error was recorded.
Chapter 13 | Basic Administration Protocols OAM Configuration Figure 322: Showing Continuity Check Errors OAM Configuration The switch provides OAM (Operation, Administration, and Maintenance) remote management tools required to monitor and maintain the links to subscriber CPEs (Customer Premise Equipment). This section describes functions including enabling OAM for selected ports, loopback testing, and displaying remote device information.
Chapter 13 | Basic Administration Protocols OAM Configuration Table 34: OAM Operation State (Continued) ◆ ◆ State Description Send Local And Remote The local OAM entity has discovered the peer but has not yet accepted or rejected the configuration of the peer. Send Local And Remote OK OAM peering is allowed by the local device. OAM Peering Locally Rejected The local OAM entity rejects the peering. OAM Peering Remotely Rejected The remote OAM entity rejects the peering.
Chapter 13 | Basic Administration Protocols OAM Configuration If reporting is enabled and an errored frame link event occurs, the local OAM entity (this switch) sends an Event Notification OAMPDU to the remote OAM entity. The Errored Frame Event TLV includes the number of errored frames detected during the specified period. ■ Status – Enables reporting of errored frame link events.
Chapter 13 | Basic Administration Protocols OAM Configuration Displaying Statistics Use the Administration > OAM > Counters page to display statistics for the various for OAM Messages types of OAM messages passed across each port. Parameters These parameters are displayed: ◆ Port – Port identifier. (Range: 1-12) ◆ Clear – Clears statistical counters for the selected ports.
Chapter 13 | Basic Administration Protocols OAM Configuration ◆ The time of locally generated events can be accurately retrieved from the sysUpTime variable. For remotely generated events, the time of an event is indicated by the reception of an Event Notification OAMPDU from the peer. Web Interface To display link events for the selected port: 1. Click Administration, OAM, Event Log. 2. Select a port from the drop-down list.
Chapter 13 | Basic Administration Protocols OAM Configuration conditions. This switch does not support the unidirectional function, but can parse error messages sent from a peer with unidirectional capability. ◆ Link Monitor – Shows if the OAM entity can send and receive Event Notification OAMPDUs. ◆ MIB Variable Retrieval – Shows if the OAM entity can send and receive Variable Request and Response OAMPDUs. Web Interface To display information about attached OAM-enabled devices: 1.
Chapter 13 | Basic Administration Protocols OAM Configuration Parameters These parameters are displayed: Loopback Mode of Remote Device ◆ Port – Port identifier. (Range: 1-12) ◆ Loopback Mode – Shows if loop back mode is enabled on the peer. This attribute must be enabled before starting the loopback test. ◆ Loopback Status – Shows if loopback testing is currently running. Loopback Test Parameters ◆ Packet Number – Number of packets to send.
Chapter 13 | Basic Administration Protocols OAM Configuration ■ Loss Rate – The percentage of packets for which there was no response. Web Interface To initiate a loop back test to the peer device attached to the selected port: 1. Click Administration, OAM, Remote Loop Back. 2. Select Remote Loopback Test from the Action list. 3. Select the port on which to initiate remote loop back testing, enable the Loop Back Mode attribute, and click Apply. 4.
Chapter 13 | Basic Administration Protocols UDLD Configuration ◆ Loss Rate – The percentage of packets transmitted for which there was no response. Web Interface To display the results of remote loop back testing for each port for which this information is available: 1. Click Administration, OAM, Remote Loopback. 2. Select Show Test Result from the Action list.
Chapter 13 | Basic Administration Protocols UDLD Configuration ◆ When a loopback event is detected on an interface or when a interface is released from a shutdown state caused by a loopback event, a trap message is sent and the event recorded in the system log. ◆ Loopback detection must be enabled both globally and on an interface for loopback detection to take effect.
Chapter 13 | Basic Administration Protocols UDLD Configuration When the recovery interval is changed, any ports shut down by UDLD will be reset. Web Interface To configure the UDLD message probe interval, detection interval, and recovery interval: 1. Click Administration, UDLD, Configure Global. 2. Select Configure Global from the Step list. 3. Configure the message and detection intervals. 4. Enable automatic recovery if required, and set the recovery interval. 5. Click Apply.
Chapter 13 | Basic Administration Protocols UDLD Configuration get through a link and reach the other end, even though some of them might get dropped during the transmission.) Since this behavior must be the same on all the neighbors, the sender of the echoes expects to receive an echo in reply. If the detection process ends without the proper echo information being received, the link is considered to be unidirectional.
Chapter 13 | Basic Administration Protocols UDLD Configuration ◆ Detection Interval – The period the switch remains in detection state after discovering a neighbor. Web Interface To enable UDLD and aggressive mode: 1. Click Administration, UDLD, Configure Interface. 2. Enable UDLD and aggressive mode on the required ports. 3. Click Apply.
Chapter 13 | Basic Administration Protocols UDLD Configuration ◆ Message Interval – The interval between UDLD probe messages for ports in advertisement phase. ◆ Detection Interval – The period the switch remains in detection state after discovering a neighbor. Web Interface To display UDLD neighbor information: 1. Click Administration, UDLD, Show Information. 2. Select an interface from the Port list.
14 IP Configuration This chapter describes how to configure an IP interface for management access to the switch over the network. This switch supports both IP Version 4 and Version 6, and can be managed simultaneously through either of these address types. You can manually configure a specific IPv4 or IPv6 address or direct the switch to obtain an IPv4 address from a BOOTP or DHCP server when it is powered on. An IPv6 address can either be manually configured or dynamically generated.
Chapter 14 | IP Configuration Using the Ping Function The actual packet size will be eight bytes larger than the size specified because the switch adds header information. ◆ The same link-local address may be used by different interfaces/nodes in different zones (RFC 4007). Therefore, when specifying a link-local address, include zone-id information indicating the VLAN identifier after the % delimiter. For example, FE80::7272%1 identifies VLAN 1 as the interface.
Chapter 14 | IP Configuration Using the Trace Route Function Figure 332: Pinging a Network Device Using the Trace Route Function Use the IP > General > Trace Route page to show the route packets take to the specified destination. Parameters These parameters are displayed: ◆ Destination IP Address – IPv4/IPv6 address of the host. ◆ IPv4 Max Failures – The maximum number of failures before which the trace route is terminated.
Chapter 14 | IP Configuration Address Resolution Protocol sequence of these messages, terminating only when the maximum timeout has been reached, may indicate this problem with the target device. ◆ The same link-local address may be used by different interfaces/nodes in different zones (RFC 4007). Therefore, when specifying a link-local address, include zone-id information indicating the VLAN identifier after the % delimiter.
Chapter 14 | IP Configuration Setting the Switch’s IP Address (IP Version 4) If there is no entry for an IP address in the ARP cache, the switch will broadcast an ARP request packet to all devices on the network. The ARP request contains the following fields similar to that shown in this example: Table 36: Address Resolution Protocol destination IP address 10.1.0.19 destination MAC address ? source IP address 10.1.0.
Chapter 14 | IP Configuration Setting the Switch’s IP Address (IP Version 4) Web Interface To configure an IPv4 default gateway for the switch: 1. Click System, IP. 2. Select Configure Global from the Action list. 3. Enter the IPv4 default gateway. 4. Click Apply. Figure 334: Configuring the IPv4 Default Gateway Configuring IPv4 Use the System > IP (Configure Interface – Add Address) page to configure an IPv4 Interface Settings address for the switch.
Chapter 14 | IP Configuration Setting the Switch’s IP Address (IP Version 4) ◆ IP Address Type – Specifies a primary or secondary IP address. An interface can have only one primary IP address, but can have many secondary IP addresses. In other words, secondary addresses need to be specified if more than one IP subnet can be accessed through this interface. For initial configuration, set this parameter to Primary.
Chapter 14 | IP Configuration Setting the Switch’s IP Address (IP Version 4) Figure 335: Configuring a Static IPv4 Address To obtain an dynamic IPv4 address through DHCP/BOOTP for the switch: 1. Click System, IP. 2. Select Configure Interface from the Step list. 3. Select Add Address from the Action list. 4. Select the VLAN through which the management station is attached, set the IP Address Mode to “DHCP” or “BOOTP.” 5. Click Apply to save your changes. 6.
Chapter 14 | IP Configuration Setting the Switch’s IP Address (IP Version 6) Note: If you lose the management connection, make a console connection to the switch and enter “show ip interface” to determine the new switch address. Renewing DCHP – DHCP may lease addresses to clients indefinitely or for a specific period of time. If the address expires or the switch is moved to another network segment, you will lose management access to the switch.
Chapter 14 | IP Configuration Setting the Switch’s IP Address (IP Version 6) address is easy to set up, and may be useful for simple networks or basic troubleshooting tasks. However, to connect to a larger network with multiple segments, the switch must be configured with a global unicast address. Both link-local and global unicast address types can either be dynamically assigned (using the Configure Interface page) or manually configured (using the Add IPv6 Address page).
Chapter 14 | IP Configuration Setting the Switch’s IP Address (IP Version 6) Figure 338: Configuring the IPv6 Default Gateway Configuring IPv6 Use the IP > IPv6 Configuration (Configure Interface - VLAN) page to configure Interface Settings general IPv6 settings for the selected VLAN, including auto-configuration of a global unicast interface address, explicit configuration of a link local interface address, the MTU size, and neighbor discovery protocol settings for duplicate address detection and the nei
Chapter 14 | IP Configuration Setting the Switch’s IP Address (IP Version 6) using the modified EUI-64 form of the interface identifier (i.e., the switch’s MAC address). ◆ ■ If a link local address has not yet been assigned to this interface, this command will dynamically generate one. The link-local address is made with an address prefix in the range of FE80~FEBF and a host portion based the switch’s MAC address in modified EUI-64 format.
Chapter 14 | IP Configuration Setting the Switch’s IP Address (IP Version 6) ◆ ■ Duplicate address detection is stopped on any interface that has been suspended (see “Configuring VLAN Groups” on page 152). While an interface is suspended, all unicast IPv6 addresses assigned to that interface are placed in a “pending” state. Duplicate address detection is automatically restarted when the interface is administratively re-activated.
Chapter 14 | IP Configuration Setting the Switch’s IP Address (IP Version 6) ■ Both M and O flags are set to 1: DHCPv6 is used for both address and other configuration settings. This combination is known as DHCPv6 stateful autoconfiguration, in which a DHCPv6 server assigns stateful addresses to IPv6 hosts. ■ The M flag is set to 0, and the O flag is set to 1: DHCPv6 is used only for other configuration settings.
Chapter 14 | IP Configuration Setting the Switch’s IP Address (IP Version 6) 6. Click Apply. Figure 339: Configuring General Settings for an IPv6 Interface 0 To configure RA Guard for the switch: 1. Click IP, IPv6 Configuration. 2. Select Configure Interface from the Action list. 3. Select RA Guard mode. 4. Enable RA Guard for untrusted interfaces. 5. Click Apply.
Chapter 14 | IP Configuration Setting the Switch’s IP Address (IP Version 6) Configuring an Use the IP > IPv6 Configuration (Add IPv6 Address) page to configure an IPv6 IPv6 Address interface for management access over the network, or for creating an interface to multiple subnets. Command Usage ◆ All IPv6 addresses must be formatted according to RFC 2373 “IPv6 Addressing Architecture,” using 8 colon-separated 16-bit hexadecimal values.
Chapter 14 | IP Configuration Setting the Switch’s IP Address (IP Version 6) Parameters These parameters are displayed: ◆ VLAN – ID of a configured VLAN which is to be used for management access, or for creating an interface to multiple subnets. By default, all ports on the switch are members of VLAN 1. However, the management station can be attached to a port belonging to any VLAN, as long as that VLAN has been assigned an IP address.
Chapter 14 | IP Configuration Setting the Switch’s IP Address (IP Version 6) ■ ◆ Link Local – Configures an IPv6 link-local address. ■ The address prefix must be in the range of FE80~FEBF. ■ You can configure only one link-local address per interface. ■ The specified address replaces a link-local address that was automatically generated for the interface. IPv6 Address – IPv6 address assigned to this interface. Web Interface To configure an IPv6 address: 1. Click IP, IPv6 Configuration. 2.
Chapter 14 | IP Configuration Setting the Switch’s IP Address (IP Version 6) In addition to the unicast addresses assigned to an interface, a node is also required to listen to the all-nodes multicast addresses FF01::1 (interface-local scope) and FF02::1 (link-local scope). FF01::1/16 is the transient interface-local multicast address for all attached IPv6 nodes, and FF02::1/16 is the link-local multicast address for all attached IPv6 nodes.
Chapter 14 | IP Configuration Setting the Switch’s IP Address (IP Version 6) Showing the IPv6 Use the IP > IPv6 Configuration (Show IPv6 Neighbor Cache) page to display the Neighbor Cache IPv6 addresses detected for neighbor devices. Parameters These parameters are displayed: Table 37: Show IPv6 Neighbors - display description Field Description IPv6 Address IPv6 address of neighbor Age The time since the address was verified as reachable (in seconds).
Chapter 14 | IP Configuration Setting the Switch’s IP Address (IP Version 6) Figure 343: Showing IPv6 Neighbors Showing Use the IP > IPv6 Configuration (Show Statistics) page to display statistics about IPv6 Statistics IPv6 traffic passing through this switch.
Chapter 14 | IP Configuration Setting the Switch’s IP Address (IP Version 6) Parameters These parameters are displayed: Table 38: Show IPv6 Statistics - display description Field Description IPv6 Statistics IPv6 Received Total The total number of input datagrams received by the interface, including those received in error.
Chapter 14 | IP Configuration Setting the Switch’s IP Address (IP Version 6) Table 38: Show IPv6 Statistics - display description (Continued) Field Description IPv6 Transmitted Forwards Datagrams The number of output datagrams which this entity received and forwarded to their final destinations. In entities which do not act as IPv6 routers, this counter will include only those packets which were SourceRouted via this entity, and the Source-Route processing was successful.
Chapter 14 | IP Configuration Setting the Switch’s IP Address (IP Version 6) Table 38: Show IPv6 Statistics - display description (Continued) Field Description Neighbor Advertisement Messages The number of ICMP Neighbor Advertisement messages received by the interface. Redirect Messages The number of Redirect messages received by the interface. Group Membership Query Messages The number of ICMPv6 Group Membership Query messages received by the interface.
Chapter 14 | IP Configuration Setting the Switch’s IP Address (IP Version 6) Table 38: Show IPv6 Statistics - display description (Continued) Field Description Other Errors The number of received UDP datagrams that could not be delivered for reasons other than the lack of an application at the destination port. Output The total number of UDP datagrams sent from this entity. Web Interface To show the IPv6 statistics: 1. Click IP, IPv6 Configuration. 2. Select Show Statistics from the Action list. 3.
Chapter 14 | IP Configuration Setting the Switch’s IP Address (IP Version 6) Figure 345: Showing IPv6 Statistics (ICMPv6) Figure 346: Showing IPv6 Statistics (UDP) – 546 –
Chapter 14 | IP Configuration Setting the Switch’s IP Address (IP Version 6) Showing the MTU for Use the IP > IPv6 Configuration (Show MTU) page to display the maximum Responding transmission unit (MTU) cache for destinations that have returned an ICMP packetDestinations too-big message along with an acceptable MTU to this switch.
Chapter 14 | IP Configuration Setting the Switch’s IP Address (IP Version 6) – 548 –
15 IP Services This chapter describes the following IP services: ◆ DNS – Configures default domain names, identifies servers to use for dynamic lookup, and shows how to configure static entries. ◆ DHCP – Configures client, relay, dynamic provisioning, and DHCP server. ◆ PPPoE Intermediate Agent – Configures PPPoE Intermediate Agent (PPPoE IA) relay parameters required for passing authentication messages between a client and broadband remote access servers.
Chapter 15 | IP Services Domain Name Service Parameters These parameters are displayed: ◆ Domain Lookup – Enables DNS host name-to-address translation. (Default: Disabled) ◆ Default Domain Name – Defines the default domain name appended to incomplete host names. Do not include the initial dot that separates the host name from the domain name. (Range: 1-127 alphanumeric characters) Web Interface To configure general settings for DNS: 1. Click IP Service, DNS. 2.
Chapter 15 | IP Services Domain Name Service checking with the specified name servers for a match (see “Configuring a List of Name Servers” on page 552). ◆ If all name servers are deleted, DNS will automatically be disabled. Parameters These parameters are displayed: Domain Name – Name of the host. Do not include the initial dot that separates the host name from the domain name. (Range: 1-127 characters) Web Interface To create a list domain names: 1. Click IP Service, DNS. 2.
Chapter 15 | IP Services Domain Name Service Configuring a List of Use the IP Service > DNS - General (Add Name Server) page to configure a list of Name Servers name servers to be tried in sequential order. Command Usage ◆ To enable DNS service on this switch, configure one or more name servers, and enable domain lookup status (see “Configuring General DNS Service Parameters” on page 549).
Chapter 15 | IP Services Domain Name Service Figure 352: Showing the List of Name Servers for DNS Configuring Use the IP Service > DNS - Static Host Table (Add) page to manually configure static Static DNS Host to entries in the DNS table that are used to map domain names to IP addresses. Address Entries Command Usage ◆ Static entries may be used for local devices connected directly to the attached network, or for commonly used resources located elsewhere on the network.
Chapter 15 | IP Services Domain Name Service To show static entries in the DNS table: 1. Click IP Service, DNS, Static Host Table. 2. Select Show from the Action list. Figure 354: Showing Static Entries in the DNS Table Displaying the Use the IP Service > DNS - Cache page to display entries in the DNS cache that have DNS Cache been learned via the designated name servers. Command Usage ◆ Servers or other network devices may support one or more connections via multiple IP addresses.
Chapter 15 | IP Services Dynamic Host Configuration Protocol Web Interface To display entries in the DNS cache: 1. Click IP Service, DNS, Cache. Figure 355: Showing Entries in the DNS Cache Dynamic Host Configuration Protocol Dynamic Host Configuration Protocol (DHCP) can dynamically allocate an IP address and other configuration information to network clients when they boot up.
Chapter 15 | IP Services Dynamic Host Configuration Protocol ◆ By default, DHCP option 66/67 parameters are not carried in a DHCP server reply. To ask for a DHCP reply with option 66/67 information, the DHCP client request sent by this switch includes a “parameter request list” asking for this information. Besides, the client request also includes a “vendor class identifier” that allows the DHCP server to identify the device, and select the appropriate configuration file for download.
Chapter 15 | IP Services Dynamic Host Configuration Protocol Figure 356: Specifying A DHCP Client Identifier Configuring Use the IP Service > DHCP > Relay page to configure DHCP relay service for DHCP Relay Service attached host devices, including DHCP option 82 information. DHCP provides an option for sending information about its DHCP clients to the DHCP server (specifically, the interface on the relay server through which the DHCP client request was received).
Chapter 15 | IP Services Dynamic Host Configuration Protocol Figure 357: Layer 2 DHCP Relay Service Provides IP address compatible with switch segment to which client is attached DHCP Server Command Usage ◆ You must specify the IP address for at least one active DHCP server. Otherwise, the switch’s DHCP relay agent will not be able to forward client requests to a DHCP server. Up to five DHCP servers can be specified in order of preference.
Chapter 15 | IP Services Dynamic Host Configuration Protocol ◆ DHCP reply packets received by the relay agent are handled as follows: When the relay agent receives a DHCP reply packet with Option 82 information over the management VLAN, it first ensures that the packet is destined for it. ◆ ◆ ■ If the RID in the DHCP reply packet is not identical with that configured on the switch, the option 82 information is retained, and the packet is flooded onto the VLAN through which it was received.
Chapter 15 | IP Services Dynamic Host Configuration Protocol Parameters These parameters are displayed: ◆ Insertion of Relay Information – Enable DHCP Option 82 information relay. (Default: Disabled) ◆ DHCP Option Policy – Specifies how to handle client requests which already contain DHCP Option 82 information: ■ Drop - Floods the original request packet onto the VLAN that received it instead of relaying it. (This is the default.
Chapter 15 | IP Services Dynamic Host Configuration Protocol 4. Specify whether or not include “type” and “length” sub-options. 5. Set the frame format used for the remote ID. 6. Enter up to five IP addresses for DHCP servers or relay servers in order of preference for any VLAN. 7. Click Apply. Figure 358: Configuring DHCP Relay Service Enabling DHCP Use the IP Service > DHCP > Dynamic Provision to enable dynamic provisioning via Dynamic Provision DHCP.
Chapter 15 | IP Services Configuring the PPPoE Intermediate Agent Web Interface To enable dynamic provisioning via DHCP: 1. Click IP Service, DHCP, Dynamic Provision. 2. Mark the Enable box if dynamic provisioning is configured on the DHCP deamon, and required for bootup. 3. Click Apply.
Chapter 15 | IP Services Configuring the PPPoE Intermediate Agent ◆ Access Node Identifier – String identifying this switch as an PPPoE IA to the PPPoE server. (Range: 1-48 ASCII characters: Default: IP address of first IPv4 interface on the switch.) The switch uses the access-node-identifier to generate the circuit-id for PPPoE discovery stage packets sent to the BRAS, but does not modify the source or destination MAC address of these PPPoE discovery packets.
Chapter 15 | IP Services Configuring the PPPoE Intermediate Agent ◆ PPPoE IA Status – Enables the PPPoE IA on an interface. (Default: Disabled) Note that PPPoE IA must also be enabled globally on the switch for this command to take effect. ◆ ◆ Trust Status – Sets an interface to trusted mode to indicate that it is connected to a PPPoE server. (Default: Disabled) ■ Set any interfaces connecting the switch to a PPPoE Server as trusted.
Chapter 15 | IP Services Configuring the PPPoE Intermediate Agent Web Interface To configure interface settings for PPPoE IA: 1. Click IP Service, PPPoE Intermediate Agent. 2. Select Configure Interface from the Step list. 3. Select Port or Trunk interface type. 4. Enable PPPoE IA on an interface, set trust status, enable vendor tag stripping if required, and set the circuit ID and remote ID. 5. Click Apply.
Chapter 15 | IP Services Configuring the PPPoE Intermediate Agent ◆ Dropped – Dropped PPPoE active discovery messages. ■ Response from untrusted – Response from an interface which not been configured as trusted. ■ Request towards untrusted – Request sent to an interface which not been configured as trusted. ■ Malformed – Corrupted PPPoE message. Web Interface To show statistics for PPPoE IA protocol messages: 1. Click IP Service, PPPoE Intermediate Agent. 2.
16 Multicast Filtering This chapter describes how to configure the following multicast services: ◆ IGMP Snooping – Configures snooping and query parameters. ◆ Filtering and Throttling – Filters specified multicast service, or throttles the maximum of multicast groups allowed on an interface. ◆ MLD Snooping – Configures snooping and query parameters for IPv6.
Chapter 16 | Multicast Filtering Overview Figure 363: Multicast Filtering Concept Unicast Flow Multicast Flow This switch can use Internet Group Management Protocol (IGMP) to filter multicast traffic. IGMP Snooping can be used to passively monitor or “snoop” on exchanges between attached hosts and an IGMP-enabled device, most commonly a multicast router. In this way, the switch can discover the ports that want to join a multicast group, and set its filters accordingly.
Chapter 16 | Multicast Filtering Layer 2 IGMP (Snooping and Query for IPv4) Layer 2 IGMP (Snooping and Query for IPv4) IGMP Snooping and Query – If multicast routing is not supported on other switches in your network, you can use IGMP Snooping and IGMP Query (page 570) to monitor IGMP service requests passing between multicast clients and servers, and dynamically configure the switch ports which need to forward multicast traffic.
Chapter 16 | Multicast Filtering Layer 2 IGMP (Snooping and Query for IPv4) Static IGMP Router Interface – If IGMP snooping cannot locate the IGMP querier, you can manually designate a known IGMP querier (i.e., a multicast router/switch) connected over the network to an interface on your switch (page 574). This interface will then join all the current multicast groups supported by the attached router/switch to ensure that multicast traffic is passed to all appropriate interfaces within the switch.
Chapter 16 | Multicast Filtering Layer 2 IGMP (Snooping and Query for IPv4) ◆ IGMP Querier – A router, or multicast-enabled switch, can periodically ask their hosts if they want to receive multicast traffic. If there is more than one router/ switch on the LAN performing IP multicasting, one of these devices is elected “querier” and assumes the role of querying the LAN for group members.
Chapter 16 | Multicast Filtering Layer 2 IGMP (Snooping and Query for IPv4) If a topology change notification (TCN) is received, and all the uplink ports are subsequently deleted, a time out mechanism is used to delete all of the currently learned multicast channels. When a new uplink port starts up, the switch sends unsolicited reports for all currently learned channels out the new uplink port.
Chapter 16 | Multicast Filtering Layer 2 IGMP (Snooping and Query for IPv4) Once the table used to store multicast entries for IGMP snooping and multicast routing is filled, no new entries are learned. If no router port is configured in the attached VLAN, and unregistered-flooding is disabled, any subsequent multicast traffic not found in the table is dropped, otherwise it is flooded throughout the VLAN. ◆ Forwarding Priority – Assigns a CoS priority to all multicast traffic.
Chapter 16 | Multicast Filtering Layer 2 IGMP (Snooping and Query for IPv4) Figure 364: Configuring General Settings for IGMP Snooping Specifying Static Use the Multicast > IGMP Snooping > Multicast Router (Add Static Multicast Router) Interfaces for a page to statically attach an interface to a multicast router/switch. Multicast Router Depending on network connections, IGMP snooping may not always be able to locate the IGMP querier.
Chapter 16 | Multicast Filtering Layer 2 IGMP (Snooping and Query for IPv4) Show Static Multicast Router ◆ VLAN – Selects the VLAN for which to display any configured static multicast routers. ◆ Interface – Shows the interface to which the specified static multicast routers are attached. Show Current Multicast Router ◆ VLAN – Selects the VLAN for which to display any currently active multicast routers. ◆ Interface – Shows the interface to which an active multicast router is attached.
Chapter 16 | Multicast Filtering Layer 2 IGMP (Snooping and Query for IPv4) Figure 366: Showing Static Interfaces Attached a Multicast Router Multicast routers that are attached to ports on the switch use information obtained from IGMP, along with a multicast routing protocol (such as PIM) to support IP multicasting across the Internet. These routers may be dynamically discovered by the switch or statically assigned to an interface on the switch.
Chapter 16 | Multicast Filtering Layer 2 IGMP (Snooping and Query for IPv4) ports attached to participating hosts to a common VLAN, and then assign the multicast service to that VLAN group. Command Usage ◆ Static multicast addresses are never aged out. ◆ When a multicast address is assigned to an interface in a specific VLAN, the corresponding traffic can only be forwarded to ports within that VLAN.
Chapter 16 | Multicast Filtering Layer 2 IGMP (Snooping and Query for IPv4) To show the static interfaces assigned to a multicast service: 1. Click Multicast, IGMP Snooping, IGMP Member. 2. Select Show Static Member from the Action list. 3. Select the VLAN for which to display this information.
Chapter 16 | Multicast Filtering Layer 2 IGMP (Snooping and Query for IPv4) Setting IGMP Use the Multicast > IGMP Snooping > Interface (Configure VLAN, Configure Port, or Snooping Status per Configure Trunk) page to configure IGMP snooping attributes for a VLAN. To Interface configure snooping globally, refer to “Configuring IGMP Snooping and Query Parameters” on page 570. Command Usage Multicast Router Discovery There have been many mechanisms used in the past to identify multicast routers.
Chapter 16 | Multicast Filtering Layer 2 IGMP (Snooping and Query for IPv4) ◆ Multicast Router Termination – These messages are sent when a router stops IP multicast routing functions on an interface. Termination messages are sent by multicast routers when: ■ Multicast forwarding is disabled on an interface. ■ An interface is administratively disabled. ■ The router is gracefully shut down. Advertisement and Termination messages are sent to the All-Snoopers multicast address.
Chapter 16 | Multicast Filtering Layer 2 IGMP (Snooping and Query for IPv4) If immediate leave is not used, a multicast router (or querier) will send a groupspecific query message when an IGMPv2 group leave message is received. The router/querier stops forwarding traffic for that group only if no host replies to the query within the specified time out period. Note that this time out is set to Last Member Query Interval * Robustness Variable (fixed at 2) as defined in RFC 2236.
Chapter 16 | Multicast Filtering Layer 2 IGMP (Snooping and Query for IPv4) Membership reports exceeding the configured limits for the interface are dropped. This command can be used to prevent DoS attacks. Rules Used for Proxy Reporting When IGMP Proxy Reporting is disabled, the switch will use a null IP address for the source of IGMP query and report messages unless a proxy query address has been set.
Chapter 16 | Multicast Filtering Layer 2 IGMP (Snooping and Query for IPv4) ◆ Last Member Query Interval – The interval to wait for a response to a groupspecific or group-and-source-specific query message. (Range: 1-31744 tenths of a second in multiples of 10; Default: 1 second) When a multicast host leaves a group, it sends an IGMP leave message.
Chapter 16 | Multicast Filtering Layer 2 IGMP (Snooping and Query for IPv4) Web Interface To configure IGMP snooping on a VLAN: 1. Click Multicast, IGMP Snooping, Interface. 2. Select Configure VLAN from the Action list. 3. Select the VLAN to configure and update the required parameters. 4. Click Apply. Figure 370: Configuring IGMP Snooping on a VLAN To show the interface settings for IGMP snooping: 1. Click Multicast, IGMP Snooping, Interface. 2. Select Show VLAN Information from the Action list.
Chapter 16 | Multicast Filtering Layer 2 IGMP (Snooping and Query for IPv4) Filtering IGMP Query Use the Multicast > IGMP Snooping > Interface (Configure Interface) page to and Report Packets configure an interface to drop IGMP query or report packets. Parameters These parameters are displayed: ◆ Interface – Port or Trunk identifier. ◆ IGMP Query Drop – Configures an interface to drop any IGMP query packets received on the specified interface.
Chapter 16 | Multicast Filtering Layer 2 IGMP (Snooping and Query for IPv4) Displaying Multicast Use the Multicast > IGMP Snooping > Forwarding Entry page to display the Groups Discovered by forwarding entries learned through IGMP Snooping. IGMP Snooping Command Usage To display information about multicast groups, IGMP Snooping must first be enabled on the switch (see page 570).
Chapter 16 | Multicast Filtering Layer 2 IGMP (Snooping and Query for IPv4) Displaying Use the Multicast > IGMP Snooping > Statistics pages to display IGMP snooping IGMP Snooping protocol-related statistics for the specified interface. Statistics Parameters These parameters are displayed: ◆ VLAN – VLAN identifier. (Range: 1-4094) ◆ Port – Port identifier. (Range: 1-12) ◆ Trunk – Trunk identifier. (Range: 1-12) Query Statistics ◆ Other Querier – IP address of remote querier on this interface.
Chapter 16 | Multicast Filtering Layer 2 IGMP (Snooping and Query for IPv4) ◆ V3 Warning Count – The number of times the query version received (Version 3) does not match the version configured for this interface. VLAN, Port, and Trunk Statistics Input Statistics ◆ Report – The number of IGMP membership reports received on this interface. ◆ Leave – The number of leave messages received on this interface. ◆ G Query – The number of general query messages received on this interface.
Chapter 16 | Multicast Filtering Layer 2 IGMP (Snooping and Query for IPv4) Figure 374: Displaying IGMP Snooping Statistics – Query To display IGMP snooping protocol-related statistics for a VLAN: 1. Click Multicast, IGMP Snooping, Statistics. 2. Select Show VLAN Statistics from the Action list. 3. Select a VLAN.
Chapter 16 | Multicast Filtering Layer 2 IGMP (Snooping and Query for IPv4) Figure 375: Displaying IGMP Snooping Statistics – VLAN To display IGMP snooping protocol-related statistics for a port: 1. Click Multicast, IGMP Snooping, Statistics. 2. Select Show Port Statistics from the Action list. 3. Select a Port.
Chapter 16 | Multicast Filtering Filtering and Throttling IGMP Groups Filtering and Throttling IGMP Groups In certain switch applications, the administrator may want to control the multicast services that are available to end users. For example, an IP/TV service based on a specific subscription plan.
Chapter 16 | Multicast Filtering Filtering and Throttling IGMP Groups Figure 377: Enabling IGMP Filtering and Throttling Configuring IGMP Use the Multicast > IGMP Snooping > Filter (Configure Profile – Add) page to create Filter Profiles an IGMP profile and set its access mode. Then use the (Add Multicast Group Range) page to configure the multicast groups to filter.
Chapter 16 | Multicast Filtering Filtering and Throttling IGMP Groups Web Interface To create an IGMP filter profile and set its access mode: 1. Click Multicast, IGMP Snooping, Filter. 2. Select Configure Profile from the Step list. 3. Select Add from the Action list. 4. Enter the number for a profile, and set its access mode. 5. Click Apply. Figure 378: Creating an IGMP Filtering Profile To show the IGMP filter profiles: 1. Click Multicast, IGMP Snooping, Filter. 2.
Chapter 16 | Multicast Filtering Filtering and Throttling IGMP Groups 4. Select the profile to configure, and add a multicast group address or range of addresses. 5. Click Apply. Figure 380: Adding Multicast Groups to an IGMP Filtering Profile To show the multicast groups configured for an IGMP filter profile: 1. Click Multicast, IGMP Snooping, Filter. 2. Select Configure Profile from the Step list. 3. Select Show Multicast Group Range from the Action list. 4.
Chapter 16 | Multicast Filtering Filtering and Throttling IGMP Groups set to replace, the switch randomly removes an existing group and replaces it with the new multicast group. Parameters These parameters are displayed: ◆ Interface – Port or trunk identifier. An IGMP profile or throttling setting can be applied to a port or trunk. When ports are configured as trunk members, the trunk uses the settings applied to the first port member in the trunk.
Chapter 16 | Multicast Filtering MLD Snooping (Snooping and Query for IPv6) Figure 382: Configuring IGMP Filtering and Throttling Interface Settings MLD Snooping (Snooping and Query for IPv6) Multicast Listener Discovery (MLD) snooping operates on IPv6 traffic and performs a similar function to IGMP snooping for IPv4. That is, MLD snooping dynamically configures switch ports to limit IPv6 multicast traffic so that it is forwarded only to ports with users that want to receive it.
Chapter 16 | Multicast Filtering MLD Snooping (Snooping and Query for IPv6) An IPv6 address must be configured on the VLAN interface from which the querier will act if elected. When serving as the querier, the switch uses this IPv6 address as the query source address. The querier will not start or will disable itself after having started if it detects an IPv6 multicast router on the network. ◆ Robustness – MLD Snooping robustness variable.
Chapter 16 | Multicast Filtering MLD Snooping (Snooping and Query for IPv6) 3. Click Apply. Figure 383: Configuring General Settings for MLD Snooping Setting Immediate Use the Multicast > MLD Snooping > Interface page to configure Immediate Leave Leave Status for status for a VLAN. MLD Snooping per Interface Parameters These parameters are displayed: ◆ VLAN – A VLAN identification number.
Chapter 16 | Multicast Filtering MLD Snooping (Snooping and Query for IPv6) Figure 384: Configuring Immediate Leave for MLD Snooping Specifying Static Use the Multicast > MLD Snooping > Multicast Router (Add Static Multicast Router) Interfaces for an page to statically attach an interface to an IPv6 multicast router/switch. IPv6 Multicast Router Depending on your network connections, MLD snooping may not always be able to locate the MLD querier.
Chapter 16 | Multicast Filtering MLD Snooping (Snooping and Query for IPv6) Figure 385: Configuring a Static Interface for an IPv6 Multicast Router To show the static interfaces attached to a multicast router: 1. Click Multicast, MLD Snooping, Multicast Router. 2. Select Show Static Multicast Router from the Action list. 3. Select the VLAN for which to display this information.
Chapter 16 | Multicast Filtering MLD Snooping (Snooping and Query for IPv6) Assigning Interfaces Use the Multicast > MLD Snooping > MLD Member (Add Static Member) page to to IPv6 Multicast statically assign an IPv6 multicast service to an interface. Services Multicast filtering can be dynamically configured using MLD snooping and query messages (see “Configuring MLD Snooping and Query Parameters” on page 596).
Chapter 16 | Multicast Filtering MLD Snooping (Snooping and Query for IPv6) Figure 388: Assigning an Interface to an IPv6 Multicast Service To show the static interfaces assigned to an IPv6 multicast service: 1. Click Multicast, MLD Snooping, MLD Member. 2. Select Show Static Member from the Action list. 3. Select the VLAN for which to display this information.
Chapter 16 | Multicast Filtering MLD Snooping (Snooping and Query for IPv6) Figure 390: Showing Current Interfaces Assigned to an IPv6 Multicast Service Showing MLD Use the Multicast > MLD Snooping > Group Information page to display known Snooping Groups multicast groups, member ports, the means by which each group was learned, and and Source List the corresponding source list. Parameters These parameters are displayed: ◆ VLAN – VLAN identifier. (Range: 1-4094) ◆ Interface – Port or trunk identifier.
Chapter 16 | Multicast Filtering Multicast VLAN Registration for IPv4 Web Interface To display known MLD multicast groups: 1. Click Multicast, MLD Snooping, Group Information. 2. Select the port or trunk, and then select a multicast service assigned to that interface.
Chapter 16 | Multicast Filtering Multicast VLAN Registration for IPv4 Figure 392: MVR Concept Multicast Router Satellite Services Multicast Server Layer 2 Switch Source Port Service Network Receiver Ports Set-top Box PC TV Set-top Box TV Command Usage ◆ General Configuration Guidelines for MVR: 1. Enable MVR for a domain on the switch, and select the MVR VLAN (see “Configuring MVR Domain Settings” on page 608). 2.
Chapter 16 | Multicast Filtering Multicast VLAN Registration for IPv4 Configuring Use the Multicast > MVR (Configure Global) page to configure proxy switching and MVR Global Settings the robustness variable. Parameters These parameters are displayed: ◆ ◆ Proxy Switching – Configures MVR proxy switching, where the source port acts as a host, and the receiver port acts as an MVR router with querier service enabled.
Chapter 16 | Multicast Filtering Multicast VLAN Registration for IPv4 ■ ◆ ◆ This parameter only takes effect when MVR proxy switching is enabled. Proxy Query Interval – Configures the interval at which the receiver port sends out general queries. (Range: 2-31744 seconds; Default: 125 seconds) ■ This parameter sets the general query interval at which active receiver ports send out general queries. ■ This interval is only effective when proxy switching is enabled.
Chapter 16 | Multicast Filtering Multicast VLAN Registration for IPv4 Configuring Use the Multicast > MVR (Configure Domain) page to enable MVR globally on the MVR Domain Settings switch, and select the VLAN that will serve as the sole channel for common multicast streams supported by the service provider. Parameters These parameters are displayed: ◆ Domain ID – An independent multicast domain.
Chapter 16 | Multicast Filtering Multicast VLAN Registration for IPv4 Web Interface To configure settings for an MVR domain: 1. Click Multicast, MVR. 2. Select Configure Domain from the Step list. 3. Select a domain from the scroll-down list. 4. Enable MVR for the selected domain, select the MVR VLAN, set the forwarding priority to be assigned to all ingress multicast traffic, and set the source IP address for all control packets sent upstream as required. 5. Click Apply.
Chapter 16 | Multicast Filtering Multicast VLAN Registration for IPv4 Parameters These parameters are displayed: Configure Profile ◆ Profile Name – The name of a profile containing one or more MVR group addresses. (Range: 1-21 characters) ◆ Start IP Address – Starting IP address for an MVR multicast group. (Range: 224.0.1.0 - 239.255.255.255) ◆ End IP Address – Ending IP address for an MVR multicast group. (Range: 224.0.1.0 - 239.255.255.
Chapter 16 | Multicast Filtering Multicast VLAN Registration for IPv4 To show the configured MVR group address profiles: 1. Click Multicast, MVR. 2. Select Configure Profile from the Step list. 3. Select Show from the Action list. Figure 396: Displaying MVR Group Address Profiles To assign an MVR group address profile to a domain: 1. Click Multicast, MVR. 2. Select Associate Profile from the Step list. 3. Select Add from the Action list. 4.
Chapter 16 | Multicast Filtering Multicast VLAN Registration for IPv4 Figure 398: Showing the MVR Group Address Profiles Assigned to a Domain Configuring MVR Use the Multicast > MVR (Configure Interface) page to configure each interface that Interface Status participates in the MVR protocol as a source port or receiver port. If you are sure that only one subscriber attached to an interface is receiving multicast services, you can enable the immediate leave function.
Chapter 16 | Multicast Filtering Multicast VLAN Registration for IPv4 response to determine if there are any remaining subscribers for that multicast group before removing the port from the group list. ■ Using immediate leave can speed up leave latency, but should only be enabled on a port attached to one multicast subscriber to avoid disrupting services to other group members attached to the same interface.
Chapter 16 | Multicast Filtering Multicast VLAN Registration for IPv4 ■ By Host IP – The router/querier will not send out a group-specific query when an IGMPv2/v3 leave message is received (the same as it would without this option having been used). Instead of immediately deleting that group, it will look up the record, and only delete the group if there are no other subscribers for it on the member port. Only when all hosts on that port leave the group will the member port be deleted.
Chapter 16 | Multicast Filtering Multicast VLAN Registration for IPv4 ◆ The IP address range from 224.0.0.0 to 239.255.255.255 is used for multicast streams. MVR group addresses cannot fall within the reserved IP multicast address range of 224.0.0.x. ◆ Only IGMP version 2 or 3 hosts can issue multicast join or leave messages. If MVR must be configured for an IGMP version 1 host, the multicast groups must be statically assigned.
Chapter 16 | Multicast Filtering Multicast VLAN Registration for IPv4 Figure 400: Assigning Static MVR Groups to an Interface To show the static MVR groups assigned to an interface: 1. Click Multicast, MVR. 2. Select Configure Static Group Member from the Step list. 3. Select Show from the Action list. 4. Select an MVR domain. 5. Select the port or trunk for which to display this information.
Chapter 16 | Multicast Filtering Multicast VLAN Registration for IPv4 ◆ VLAN – The VLAN through which the service is received. Note that this may be different from the MVR VLAN if the group address has been statically assigned. ◆ Port – Indicates the source address of the multicast service (these entries are marked as “Source”), or displays an asterisk if the group address has been statically assigned.
Chapter 16 | Multicast Filtering Multicast VLAN Registration for IPv4 Displaying Use the Multicast > MVR > Show Statistics pages to display MVR protocol-related MVR Statistics statistics for the specified interface. Parameters These parameters are displayed: ◆ Domain ID – An independent multicast domain. (Range: 1-5) ◆ VLAN – VLAN identifier. (Range: 1-4094) ◆ Port – Port identifier. (Range: 1-12) ◆ Trunk – Trunk identifier.
Chapter 16 | Multicast Filtering Multicast VLAN Registration for IPv4 ◆ Join Success – The number of times a multicast group was successfully joined. ◆ Group – The number of MVR groups active on this interface. Output Statistics ◆ Report – The number of IGMP membership reports sent from this interface. ◆ Leave – The number of leave messages sent from this interface. ◆ G Query – The number of general query messages sent from this interface.
Chapter 16 | Multicast Filtering Multicast VLAN Registration for IPv4 To display MVR protocol-related statistics for a VLAN: 1. Click Multicast, MVR. 2. Select Show Statistics from the Step list. 3. Select Show VLAN Statistics from the Action list. 4. Select an MVR domain. 5. Select a VLAN. Figure 404: Displaying MVR Statistics – VLAN To display MVR protocol-related statistics for a port: 1. Click Multicast, MVR. 2. Select Show Statistics from the Step list. 3.
Chapter 16 | Multicast Filtering Multicast VLAN Registration for IPv6 Figure 405: Displaying MVR Statistics – Port Multicast VLAN Registration for IPv6 MVR6 functions in a manner similar to that described for MRV (see “Multicast VLAN Registration for IPv4” on page 604). Command Usage ◆ General Configuration Guidelines for MVR6: 1. Enable MVR6 for a domain on the switch, and select the MVR VLAN (see “Configuring MVR6 Domain Settings” on page 624). 2.
Chapter 16 | Multicast Filtering Multicast VLAN Registration for IPv6 Configuring MVR6 Use the Multicast > MVR6 (Configure Global) page to configure proxy switching Global Settings and the robustness variable. Parameters These parameters are displayed: ◆ ◆ ◆ Proxy Switching – Configures MVR proxy switching, where the source port acts as a host, and the receiver port acts as an MVR router with querier service enabled.
Chapter 16 | Multicast Filtering Multicast VLAN Registration for IPv6 ◆ ■ This parameter sets the general query interval at which active receiver ports send out general queries. ■ This interval is only effective when proxy switching is enabled. Source Port Mode – Configures the switch to forward any multicast streams within the parameters set by a profile, or to only forward multicast streams which the source port has dynamically joined.
Chapter 16 | Multicast Filtering Multicast VLAN Registration for IPv6 Configuring MVR6 Use the Multicast > MVR6 (Configure Domain) page to enable MVR6 globally on the Domain Settings switch, and select the VLAN that will serve as the sole channel for common multicast streams supported by the service provider. Parameters These parameters are displayed: ◆ Domain ID– An independent multicast domain.
Chapter 16 | Multicast Filtering Multicast VLAN Registration for IPv6 3. Select a domain from the scroll-down list. 4. Enable MVR6 for the selected domain, select the MVR6 VLAN, set the forwarding priority to be assigned to all ingress multicast traffic, and set the source IP address for all control packets sent upstream as required. 5. Click Apply.
Chapter 16 | Multicast Filtering Multicast VLAN Registration for IPv6 ◆ Profile Name – The name of a profile containing one or more MVR6 group addresses. (Range: 1-21 characters) ◆ Start IPv6 Address – Starting IP address for an MVR6 multicast group. This parameter must be a full IPv6 address including the network prefix and host address bits. ◆ End IPv6 Address – Ending IP address for an MVR6 multicast group.
Chapter 16 | Multicast Filtering Multicast VLAN Registration for IPv6 Figure 409: Displaying MVR6 Group Address Profiles To assign an MVR6 group address profile to a domain: 1. Click Multicast, MVR6. 2. Select Associate Profile from the Step list. 3. Select Add from the Action list. 4. Select a domain from the scroll-down list, and enter the name of a group profile. 5. Click Apply.
Chapter 16 | Multicast Filtering Multicast VLAN Registration for IPv6 Figure 411: Showing MVR6 Group Address Profiles Assigned to a Domain Configuring MVR6 Use the Multicast > MVR6 (Configure Interface) page to configure each interface Interface Status that participates in the MVR6 protocol as a source port or receiver port. If you are sure that only one subscriber attached to an interface is receiving multicast services, you can enable the immediate leave function.
Chapter 16 | Multicast Filtering Multicast VLAN Registration for IPv6 ■ Using immediate leave can speed up leave latency, but should only be enabled on a port attached to one multicast subscriber to avoid disrupting services to other group members attached to the same interface. ■ Immediate leave does not apply to multicast groups which have been statically assigned to a port. Parameters These parameters are displayed: ◆ Domain ID – An independent multicast domain.
Chapter 16 | Multicast Filtering Multicast VLAN Registration for IPv6 Web Interface To configure interface settings for MVR6: 1. Click Multicast, MVR6. 2. Select Configure Interface from the Step list. 3. Select an MVR6 domain. 4. Click Port or Trunk interface. 5. Set each port that will participate in the MVR6 protocol as a source port or receiver port, and optionally enable Immediate Leave on any receiver port to which only one subscriber is attached. 6. Click Apply.
Chapter 16 | Multicast Filtering Multicast VLAN Registration for IPv6 Parameters These parameters are displayed: ◆ Domain ID – An independent multicast domain. (Range: 1-5) ◆ Interface – Port or trunk identifier. ◆ VLAN – VLAN identifier. (Range: 1-4094) ◆ Group IPv6 Address – Defines a multicast service sent to the selected port. Multicast groups must be assigned from the MVR6 group range configured on the Configure General page. Web Interface To assign a static MVR6 group to an interface: 1.
Chapter 16 | Multicast Filtering Multicast VLAN Registration for IPv6 4. Select an MVR6 domain. 5. Select the port or trunk for which to display this information. Figure 414: Showing the Static MVR6 Groups Assigned to a Port Displaying MVR6 Use the Multicast > MVR6 (Show Member) page to show the multicast groups Receiver Groups either statically or dynamically assigned to the MVR6 receiver groups on each interface. Parameters These parameters are displayed: ◆ Domain ID – An independent multicast domain.
Chapter 16 | Multicast Filtering Multicast VLAN Registration for IPv6 Web Interface To display the interfaces assigned to the MVR6 receiver groups: 1. Click Multicast, MVR6. 2. Select Show Member from the Step list. 3. Select an MVR6 domain. Figure 415: Displaying MVR6 Receiver Groups Displaying Use the Multicast > MVR6 > Show Statistics pages to display MVR6 protocol-related MVR6 Statistics statistics for the specified interface.
Chapter 16 | Multicast Filtering Multicast VLAN Registration for IPv6 ◆ Specific Query Sent – The number of specific queries sent from this interface. ◆ Number of Reports Sent – The number of reports sent from this interface. ◆ Number of Leaves Sent – The number of leaves sent from this interface. VLAN, Port, and Trunk Statistics Input Statistics ◆ Report – The number of MLD membership reports received on this interface. ◆ Leave – The number of leave messages received on this interface.
Chapter 16 | Multicast Filtering Multicast VLAN Registration for IPv6 Web Interface To display statistics for MVR6 query-related messages: 1. Click Multicast, MVR6. 2. Select Show Statistics from the Step list. 3. Select Show Query Statistics from the Action list. 4. Select an MVR6 domain.
Chapter 16 | Multicast Filtering Multicast VLAN Registration for IPv6 To display MVR6 protocol-related statistics for a VLAN: 1. Click Multicast, MVR6. 2. Select Show Statistics from the Step list. 3. Select Show VLAN Statistics from the Action list. 4. Select an MVR6 domain. 5. Select a VLAN.
Chapter 16 | Multicast Filtering Multicast VLAN Registration for IPv6 To display MVR6 protocol-related statistics for a port: 1. Click Multicast, MVR6. 2. Select Show Statistics from the Step list. 3. Select Show Port Statistics from the Action list. 4. Select an MVR6 domain. 5. Select a Port.
Chapter 16 | Multicast Filtering Multicast VLAN Registration for IPv6 – 638 –
Section III Appendices This section provides additional information and includes these items: ◆ “Software Specifications” on page 641 ◆ “Troubleshooting” on page 647 ◆ “License Information” on page 649 – 639 –
Section III | Appendices – 640 –
A Software Specifications Software Features Management Local, RADIUS, TACACS+, Port Authentication (802.1X), HTTPS, SSH, Port Security, IP Filter Authentication General Security Access Control Lists (512 rules), Port Authentication (802.1X), MAC Authentication, Measures Port Security, DHCP Snooping, IP Source Guard Port Configuration 100BASE-FX: 100 Mbps full duplex (SFP).
Appendix A | Software Specifications Management Features VLAN Support Up to 4094 groups; port-based, protocol-based, tagged (802.
Appendix A | Software Specifications Standards SNMP Management access via MIB database Trap management to specified hosts RMON Groups 1, 2, 3, 9 (Statistics, History, Alarm, Event) Standards Ethernet Service OAM (ITU-T Y.1731) - partial support IEEE 802.1AB Link Layer Discovery Protocol IEEE 802.1D-2004 Spanning Tree Algorithm and traffic priorities Spanning Tree Protocol Rapid Spanning Tree Protocol Multiple Spanning Tree Protocol IEEE 802.1p Priority tags IEEE 802.1Q VLAN IEEE 802.
Appendix A | Software Specifications Management Information Bases TFTP (RFC 1350) Management Information Bases Bridge MIB (RFC 1493) Differentiated Services MIB (RFC 3289) DNS Resolver MIB (RFC 1612) ERPS MIB (ITU-T G.
Appendix A | Software Specifications Management Information Bases TCP MIB (RFC 2012) Trap (RFC 1215) UDP MIB (RFC 2013) – 645 –
Appendix A | Software Specifications Management Information Bases – 646 –
B Troubleshooting Problems Accessing the Management Interface Table 42: Troubleshooting Chart Symptom Action Cannot connect using Telnet, web browser, or SNMP software ◆ Be sure the switch is powered up. ◆ Check network cabling between the management station and the switch. ◆ Check that you have a valid network connection to the switch and that the port you are using has not been disabled.
Appendix B | Troubleshooting Using System Logs Using System Logs If a fault does occur, refer to the Installation Guide to ensure that the problem you encountered is actually caused by the switch. If the problem appears to be caused by the switch, follow these steps: 1. Enable logging. 2. Set the error messages reported to include all categories. 3. Enable SNMP. 4. Enable SNMP traps. 5. Designate the SNMP host that is to receive the error messages. 6.
C License Information This product includes copyrighted third-party software subject to the terms of the GNU General Public License (GPL), GNU Lesser General Public License (LGPL), or other related free software licenses. The GPL code used in this product is distributed WITHOUT ANY WARRANTY and is subject to the copyrights of one or more authors. For details, refer to the section "The GNU General Public License" below, or refer to the applicable license as included in the source-code archive.
Appendix C | License Information The GNU General Public License GNU GENERAL PUBLIC LICENSE TERMS AND CONDITIONS FOR COPYING, DISTRIBUTION AND MODIFICATION 1. This License applies to any program or other work which contains a notice placed by the copyright holder saying it may be distributed under the terms of this General Public License.
Appendix C | License Information The GNU General Public License b) Accompany it with a written offer, valid for at least three years, to give any third party, for a charge no more than your cost of physically performing source distribution, a complete machine-readable copy of the corresponding source code, to be distributed under the terms of Sections 1 and 2 above on a medium customarily used for software interchange; or, c) Accompany it with the information you received as to the offer to distribute c
Appendix C | License Information The GNU General Public License 9. If the distribution and/or use of the Program is restricted in certain countries either by patents or by copyrighted interfaces, the original copyright holder who places the Program under this License may add an explicit geographical distribution limitation excluding those countries, so that distribution is permitted only in or among countries not thus excluded.
Glossary ACL Access Control List. ACLs can limit network traffic and restrict access to certain users or devices by checking each packet for certain IP or MAC (i.e., Layer 2) information. ARP Address Resolution Protocol converts between IP addresses and MAC (hardware) addresses. ARP is used to locate the MAC address corresponding to a given IP address. This allows the switch to use IP addresses for routing decisions and the corresponding MAC addresses to forward packets from one hop to the next.
Glossary DHCP Snooping A technique used to enhance network security by snooping on DHCP server messages to track the physical location of hosts, ensure that hosts only use the IP addresses assigned to them, and ensure that only authorized DHCP servers are accessible. DiffServ Differentiated Services provides quality of service on large networks by employing a welldefined set of building blocks from which a variety of aggregate forwarding behaviors may be built.
Glossary GARP Generic Attribute Registration Protocol. GARP is a protocol that can be used by endstations and switches to register and propagate multicast group membership information in a switched environment so that multicast data frames are propagated only to those parts of a switched LAN containing registered endstations. Formerly called Group Address Registration Protocol. GMRP Generic Multicast Registration Protocol. GMRP allows network devices to register end stations with multicast groups.
Glossary IEEE 802.3x Defines Ethernet frame start/stop requests and timers used for flow control on full-duplex links. (Now incorporated in IEEE 802.3-2002) IGMP Internet Group Management Protocol. A protocol through which hosts can register with their local router for multicast services. If there is more than one multicast switch/router on a given subnetwork, one of the devices is made the “querier” and assumes responsibility for keeping track of group membership.
Glossary LLDP Link Layer Discovery Protocol is used to discover basic information about neighboring devices in the local broadcast domain by using periodic broadcasts to advertise information such as device identification, capabilities and configuration settings. MD5 MD5 Message-Digest is an algorithm that is used to create digital signatures. It is intended for use with 32 bit machines and is safer than the MD4 algorithm, which has been broken.
Glossary Out-of-Band Management of the network from a station not attached to the network. Management Port Authentication See IEEE 802.1X. Port Mirroring A method whereby data on a target port is mirrored to a monitor port for troubleshooting with a logic analyzer or RMON probe. This allows data on the target port to be studied unobstructively.
Glossary SNTP Simple Network Time Protocol allows a device to set its internal clock based on periodic updates from a Network Time Protocol (NTP) server. Updates can be requested from a specific NTP server, or can be received via broadcasts sent by NTP servers. SSH Secure Shell is a secure replacement for remote access functions, including Telnet. SSH can authenticate users with a cryptographic key, and encrypt data connections between management clients and the switch.
Glossary XModem A protocol used to transfer files between devices. Data is grouped in 128-byte blocks and error-corrected.
Index Numerics 802.1Q tunnel 163 configuration, guidelines 166 configuration, limitations 166 CVID to SVID map 168 description 163 ethernet type 167 interface configuration 170 mode selection 170 status, configuring 167 TPID 167 uplink 170 802.1X authenticator, configuring 347 global settings 346 port authentication 344 port authentication accounting 277, 278 supplicant, configuring 351 A AAA accounting 802.
Index broadcast storm, threshold 222, 223 C cable diagnostics 123 canonical format indicator 242 CFM basic operations 473 continuity check errors 506 continuity check messages 461, 470, 473, 474 cross-check message 470, 474 delay measure request 494 description 470 domain service access point 471, 483, 487 fault isolation 470 fault notification 471, 505 fault notification generator 473, 479, 505 fault verification 470 link trace cache 503 link trace message 471, 473, 491 loop back messages 470, 473, 492 m
Index priority, for traffic flow 257 QoS policy 250 service policy 261 setting CoS for matching packets 253 setting IP DSCP for matching packets 254 setting PHB for matching packets 253 single-rate, three-color meter 250, 254 srTCM metering 250, 254 traffic between CIR and BE, configuring response 254 traffic between CIR and PIR, configuring response 255 trTCM metering 255 two-rate, three-color meter 252 violating traffic, configuring response 256 DNS default domain name 549 displaying the cache 554 domain
Index I IEEE 802.1D 195 IEEE 802.1s 195 IEEE 802.1w 195 IEEE 802.
Index local parameters 136 partner parameters 138 protocol message statistics 135 protocol parameters 129 timeout, for LACPDU 130 last member query count, IGMP snooping 583 last member query interval, IGMP snooping 583 license information, GNU 649 Link Layer Discovery Protocol - Media Endpoint Discovery See LLDP-MED Link Layer Discovery Protocol See LLDP link trace cache, CFM 503 link trace message, CFM 471, 473, 491 link type, STA 208, 212 LLDP 379 device statistics details, displaying 401 device statisti
Index path cost 219 region name 203 region revision 203 MTU for IPv6 532 multicast filtering 567 enabling IGMP snooping 571, 580 enabling IGMP snooping per interface 579 enabling MLD snooping 596 router configuration 574 multicast groups 578, 586, 602 displaying 578, 586, 602 static 576, 578, 601, 602 multicast router discovery 579 multicast router port, displaying 576, 600 multicast services configuring 576, 601 displaying 578, 602 multicast static router port 574 configuring 574 configuring for MLD snoop
Index default ingress 231 STA 207 port security, configuring 342 ports autonegotiation 103 broadcast storm threshold 222, 223 capabilities 103 configuring 102 duplex mode 103 flow control 103 forced selection on combo ports 102 mirroring 106 mirroring local traffic 106 mirroring remote traffic 108 multicast storm threshold 223 speed 103 statistics 112 transceiver threshold, trap 122 unknown unicast storm threshold 223 power savings configuring 141 enabling per port 141 PPPoE 562–566 priority, default port
Index sending log events 377 SNMP 401 community string 415 enabling traps 422 enabling traps, mac-address changes 192 filtering IP addresses 340 global settings, configuring 403 trap manager 422 users, configuring 417, 419 SNMPv3 engine ID 404, 405 engine identifier, local 404 engine identifier, remote 405 groups 409 local users, configuring 417 remote users, configuring 419 user configuration 417, 419 views 407 SNTP setting the system clock 86 specifying servers 87 software displaying version 73 downloadi
Index transceiver thresholds configuring 121 displaying 121 trap manager 422 troubleshooting 647 trTCM police meter 255 QoS policy 252 trunk configuration 125 LACP 129 static 126 tunneling unknown VLANs, VLAN trunking 146 two rate three color meter See trTCM Type Length Value See LLDP TLV U UDLD configuration 515 interface settings 517 neighbor information 519 protocol intervals 516 unidirectional link detection 515 unknown unicast storm, threshold 223 unregistered data flooding, IGMP snooping 572 upgradi
ECS4810-12M E102016/ST-R05 149100000142A