
Web Management Guide-R01
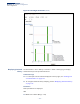
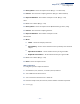
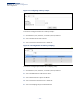
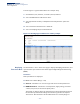
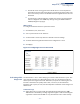
Table Of Contents
- How to Use This Guide
- Contents
- Figures
- Tables
- Getting Started
- Web Configuration
- Using the Web Interface
- Basic Management Tasks
- Displaying System Information
- Displaying Hardware/Software Versions
- Configuring Support for Jumbo Frames
- Displaying Bridge Extension Capabilities
- Managing System Files
- Setting the System Clock
- Configuring the Console Port
- Configuring Telnet Settings
- Displaying CPU Utilization
- Configuring CPU Guard
- Displaying Memory Utilization
- Resetting the System
- Interface Configuration
- VLAN Configuration
- Address Table Settings
- Spanning Tree Algorithm
- Congestion Control
- Class of Service
- Quality of Service
- VoIP Traffic Configuration
- Security Measures
- AAA (Authentication, Authorization and Accounting)
- Configuring User Accounts
- Web Authentication
- Network Access (MAC Address Authentication)
- Configuring HTTPS
- Configuring the Secure Shell
- Access Control Lists
- Filtering IP Addresses for Management Access
- Configuring Port Security
- Configuring 802.1X Port Authentication
- DoS Protection
- DHCP Snooping
- DHCPv6 Snooping
- ND Snooping
- IPv4 Source Guard
- IPv6 Source Guard
- ARP Inspection
- Application Filter
- Basic Administration Protocols
- Configuring Event Logging
- Link Layer Discovery Protocol
- Simple Network Management Protocol
- Configuring Global Settings for SNMP
- Setting Community Access Strings
- Setting the Local Engine ID
- Specifying a Remote Engine ID
- Setting SNMPv3 Views
- Configuring SNMPv3 Groups
- Configuring Local SNMPv3 Users
- Configuring Remote SNMPv3 Users
- Specifying Trap Managers
- Creating SNMP Notification Logs
- Showing SNMP Statistics
- Remote Monitoring
- Switch Clustering
- Setting a Time Range
- Ethernet Ring Protection Switching
- OAM Configuration
- UDLD Configuration
- LBD Configuration
- Multicast Filtering
- Overview
- Layer 2 IGMP (Snooping and Query for IPv4)
- Configuring IGMP Snooping and Query Parameters
- Specifying Static Interfaces for a Multicast Router
- Assigning Interfaces to Multicast Services
- Setting IGMP Snooping Status per Interface
- Filtering IGMP Packets on an Interface
- Displaying Multicast Groups Discovered by IGMP Snooping
- Displaying IGMP Snooping Statistics
- Filtering and Throttling IGMP Groups
- MLD Snooping (Snooping and Query for IPv6)
- Configuring MLD Snooping and Query Parameters
- Setting Immediate Leave Status for MLD Snooping per Interface
- Specifying Static Interfaces for an IPv6 Multicast Router
- Assigning Interfaces to IPv6 Multicast Services
- Filtering MLD Query Packets on an Interface
- Showing MLD Snooping Groups and Source List
- Displaying MLD Snooping Statistics
- Filtering and Throttling MLD Groups
- Multicast VLAN Registration for IPv4
- IP Tools
- IP Configuration
- General IP Routing
- IP Services
- Appendices

Chapter 4
| Interface Configuration
Port Configuration
– 116 –
To show ingress or egress traffic statistics for a sample entry:
1. Click Interface, Port, Statistics, or Interface, Trunk, Statistics.
2. Select Show Details from the Action menu.
3. Select Input Previous Entry or Output Previous Entry from the options for
Mode.
4. Select an interface from the Port or Trunk list.
5. Select an sampling entry from the Name list.
Figure 39: Showing Ingress Statistics for a History Sample
Displaying
Transceiver Data
Use the Interface > Port > Transceiver page to display identifying information, and
operational for optical transceivers which support Digital Diagnostic Monitoring
(DDM).
Parameters
These parameters are displayed:
◆ Port – Port number. (Range: 1-28)
◆ General – Information on connector type and vendor-related parameters.
◆ DDM Information – Information on temperature, supply voltage, laser bias
current, laser power, and received optical power.
The switch can display diagnostic information for SFP modules which support
the SFF-8472 Specification for Diagnostic Monitoring Interface for Optical
Transceivers. This information allows administrators to remotely diagnose