
Web Management Guide-R04

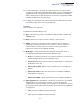
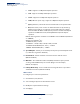
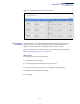
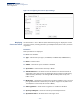
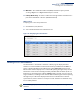
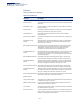
Table Of Contents
- How to Use This Guide
- Contents
- Figures
- Tables
- Getting Started
- Web Configuration
- Using the Web Interface
- Basic Management Tasks
- Displaying System Information
- Displaying Hardware/Software Versions
- Configuring Support for Jumbo Frames
- Displaying Bridge Extension Capabilities
- Managing System Files
- Setting the System Clock
- Configuring the Console Port
- Configuring Telnet Settings
- Displaying CPU Utilization
- Configuring CPU Guard
- Displaying Memory Utilization
- Resetting the System
- Interface Configuration
- VLAN Configuration
- Address Table Settings
- Spanning Tree Algorithm
- Congestion Control
- Class of Service
- Layer 2 Queue Settings
- Layer 3/4 Priority Settings
- Setting Priority Processing to IP Precedence/DSCP or CoS
- Mapping Ingress DSCP Values to Internal DSCP Values
- Mapping CoS Priorities to Internal DSCP Values
- Mapping Internal DSCP Values to Egress CoS Values
- Mapping IP Precedence Values to Internal DSCP Values
- Mapping IP Port Priority to Internal DSCP Values
- Quality of Service
- VoIP Traffic Configuration
- Security Measures
- AAA Authentication, Authorization and Accounting
- Configuring User Accounts
- Web Authentication
- Network Access (MAC Address Authentication)
- Configuring HTTPS
- Configuring the Secure Shell
- Access Control Lists
- Filtering IP Addresses for Management Access
- Configuring Port Security
- Configuring 802.1X Port Authentication
- DoS Protection
- DHCPv4 Snooping
- DHCPv6 Snooping
- IPv4 Source Guard
- IPv6 Source Guard
- ARP Inspection
- Application Filter
- Basic Administration Protocols
- Configuring Event Logging
- Link Layer Discovery Protocol
- Simple Network Management Protocol
- Configuring Global Settings for SNMP
- Setting Community Access Strings
- Setting the Local Engine ID
- Specifying a Remote Engine ID
- Setting SNMPv3 Views
- Configuring SNMPv3 Groups
- Configuring Local SNMPv3 Users
- Configuring Remote SNMPv3 Users
- Specifying Trap Managers
- Creating SNMP Notification Logs
- Showing SNMP Statistics
- Remote Monitoring
- Switch Clustering
- Setting a Time Range
- Ethernet Ring Protection Switching
- OAM Configuration
- Connectivity Fault Management
- Configuring Global Settings for CFM
- Configuring Interfaces for CFM
- Configuring CFM Maintenance Domains
- Configuring CFM Maintenance Associations
- Configuring Maintenance End Points
- Configuring Remote Maintenance End Points
- Transmitting Link Trace Messages
- Transmitting Loop Back Messages
- Transmitting Delay-Measure Requests
- Displaying Local MEPs
- Displaying Details for Local MEPs
- Displaying Local MIPs
- Displaying Remote MEPs
- Displaying Details for Remote MEPs
- Displaying the Link Trace Cache
- Displaying Fault Notification Settings
- Displaying Continuity Check Errors
- OAM Configuration
- UDLD Configuration
- LBD Configuration
- Smart Pair Configuration
- Multicast Filtering
- Overview
- Layer 2 IGMP (Snooping and Query for IPv4)
- Configuring IGMP Snooping and Query Parameters
- Specifying Static Interfaces for a Multicast Router
- Assigning Interfaces to Multicast Services
- Setting IGMP Snooping Status per Interface
- Filtering IGMP Query Packets and Multicast Data
- Displaying Multicast Groups Discovered by IGMP Snooping
- Displaying IGMP Snooping Statistics
- Filtering and Throttling IGMP Groups
- MLD Snooping (Snooping and Query for IPv6)
- Multicast VLAN Registration for IPv4
- Multicast VLAN Registration for IPv6
- Basic IP Functions
- IP Configuration
- General IP Routing
- IP Services
- Appendices
- Glossary

Chapter 4
| Interface Configuration
Showing Port or Trunk Statistics
– 119 –
◆ MTU Size – The maximum transfer unit (MTU) allowed for layer 2 packets
crossing a Gigabit or 10 Gigabit Ethernet port or trunk.
◆ Link Up Down Trap – Shows if a notification message will be sent whenever a
port link is established or broken. (Default: Enabled)
Web Interface
To display port connection parameters:
1. Click Interface, Port, General.
2. Select Show Information from the Action List.
Figure 35: Displaying Port Information
Showing Port or Trunk Statistics
Use the Interface > Port/Trunk > Statistics or Chart page to display standard
statistics on network traffic from the Interfaces Group and Ethernet-like MIBs, as
well as a detailed breakdown of traffic based on the RMON MIB. Interfaces and
Ethernet-like statistics display errors on the traffic passing through each port. This
information can be used to identify potential problems with the switch (such as a
faulty port or unusually heavy loading). RMON statistics provide access to a broad
range of statistics, including a total count of different frame types and sizes passing
through each port. All values displayed have been accumulated since the last
system reboot, and are shown as counts per second. Statistics are refreshed every
60 seconds by default.
Note:
RMON groups 2, 3 and 9 can only be accessed using SNMP management
software.