
ECS4100 Series Web Management Guide-R07
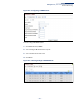
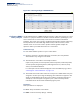
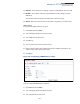
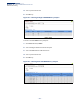
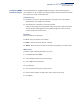
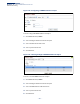
Table Of Contents
- How to Use This Guide
- Contents
- Figures
- Tables
- Getting Started
- Web Configuration
- Using the Web Interface
- Basic Management Tasks
- Displaying System Information
- Displaying Hardware/Software Versions
- Configuring Support for Jumbo Frames
- Displaying Bridge Extension Capabilities
- Managing System Files
- Setting the System Clock
- Configuring the Console Port
- Configuring Telnet Settings
- Displaying CPU Utilization
- Configuring CPU Guard
- Displaying Memory Utilization
- Resetting the System
- Using Cloud Management
- Interface Configuration
- VLAN Configuration
- Address Table Settings
- Spanning Tree Algorithm
- Congestion Control
- Class of Service
- Quality of Service
- VoIP Traffic Configuration
- Security Measures
- AAA (Authentication, Authorization and Accounting)
- Configuring User Accounts
- Web Authentication
- Network Access (MAC Address Authentication)
- Configuring HTTPS
- Configuring the Secure Shell
- Access Control Lists
- Filtering IP Addresses for Management Access
- Configuring Port Security
- Configuring 802.1X Port Authentication
- DoS Protection
- DHCP Snooping
- DHCPv6 Snooping
- IPv4 Source Guard
- IPv6 Source Guard
- ARP Inspection
- Application Filter
- Basic Administration Protocols
- Configuring Event Logging
- Link Layer Discovery Protocol
- Power over Ethernet
- Simple Network Management Protocol
- Configuring Global Settings for SNMP
- Setting Community Access Strings
- Setting the Local Engine ID
- Specifying a Remote Engine ID
- Setting SNMPv3 Views
- Configuring SNMPv3 Groups
- Configuring Local SNMPv3 Users
- Configuring Remote SNMPv3 Users
- Specifying Trap Managers
- Creating SNMP Notification Logs
- Showing SNMP Statistics
- Remote Monitoring
- Switch Clustering
- Setting a Time Range
- Ethernet Ring Protection Switching
- Connectivity Fault Management
- Configuring Global Settings for CFM
- Configuring Interfaces for CFM
- Configuring CFM Maintenance Domains
- Configuring CFM Maintenance Associations
- Configuring Maintenance End Points
- Configuring Remote Maintenance End Points
- Transmitting Link Trace Messages
- Transmitting Loop Back Messages
- Transmitting Delay-Measure Requests
- Displaying Local MEPs
- Displaying Details for Local MEPs
- Displaying Local MIPs
- Displaying Remote MEPs
- Displaying Details for Remote MEPs
- Displaying the Link Trace Cache
- Displaying Fault Notification Settings
- Displaying Continuity Check Errors
- OAM Configuration
- UDLD Configuration
- LBD Configuration
- Smart Pair Configuration
- Multicast Filtering
- Overview
- Layer 2 IGMP (Snooping and Query for IPv4)
- Configuring IGMP Snooping and Query Parameters
- Specifying Static Interfaces for a Multicast Router
- Assigning Interfaces to Multicast Services
- Setting IGMP Snooping Status per Interface
- Filtering IGMP Packets on an Interface
- Displaying Multicast Groups Discovered by IGMP Snooping
- Displaying IGMP Snooping Statistics
- Filtering and Throttling IGMP Groups
- MLD Snooping (Snooping and Query for IPv6)
- Configuring MLD Snooping and Query Parameters
- Setting Immediate Leave Status for MLD Snooping per Interface
- Specifying Static Interfaces for an IPv6 Multicast Router
- Assigning Interfaces to IPv6 Multicast Services
- Filtering MLD Query Packets on an Interface
- Showing MLD Snooping Groups and Source List
- Displaying MLD Snooping Statistics
- Filtering and Throttling MLD Groups
- Multicast VLAN Registration for IPv4
- Multicast VLAN Registration for IPv6
- IP Tools
- IP Configuration
- General IP Routing
- Unicast Routing
- Overview
- Configuring the Routing Information Protocol
- Configuring General Protocol Settings
- Clearing Entries from the Routing Table
- Specifying Network Interfaces
- Specifying Passive Interfaces
- Specifying Static Neighbors
- Configuring Route Redistribution
- Specifying an Administrative Distance
- Configuring Network Interfaces for RIP
- Displaying RIP Interface Settings
- Displaying Peer Router Information
- Resetting RIP Statistics
- IP Services
- Appendices

Chapter 13
| Basic Administration Protocols
Remote Monitoring
– 456 –
Figure 288: Showing Configured RMON Events
Configuring RMON
History Samples
Use the Administration > RMON (Configure Interface - Add - History) page to collect
statistics on a physical interface to monitor network utilization, packet types, and
errors. A historical record of activity can be used to track down intermittent
problems. The record can be used to establish normal baseline activity, which may
reveal problems associated with high traffic levels, broadcast storms, or other
unusual events. It can also be used to predict network growth and plan for
expansion before your network becomes too overloaded.
Command Usage
◆ Each index number equates to a port on the switch.
◆ If history collection is already enabled on an interface, the entry must be
deleted before any changes can be made.
◆ The information collected for each sample includes:
input octets, packets, broadcast packets, multicast packets, undersize packets,
oversize packets, fragments, jabbers, CRC alignment errors, collisions, drop
events, and network utilization.
For a description of the statistics displayed on the Show Details page, refer to
“Showing Port or Trunk Statistics” on page 114.
◆ The switch reserves two index entries for each port. If a default index entry is re-
assigned to another port using the Add page, this index will not appear in the
Show nor Show Details page for the port to which is normally assigned. For
example, if control entry 15 is assigned to port 5, this index entry will be
removed from the Show and Show Details page for port 8.
Parameters
These parameters are displayed:
◆ Port – The port number on the switch.
◆ Index - Index to this entry. (Range: 1-65535)