
Web Management Guide-R05
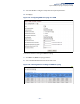
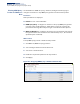
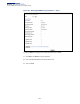
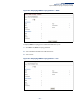
Table Of Contents
- How to Use This Guide
- Contents
- Figures
- Tables
- Getting Started
- Web Configuration
- Using the Web Interface
- Basic Management Tasks
- Displaying System Information
- Displaying Hardware/Software Versions
- Configuring Support for Jumbo Frames
- Displaying Bridge Extension Capabilities
- Managing System Files
- Setting the System Clock
- Configuring the Console Port
- Configuring Telnet Settings
- Displaying CPU Utilization
- Configuring CPU Guard
- Displaying Memory Utilization
- Resetting the System
- Using Cloud Management
- Interface Configuration
- VLAN Configuration
- Address Table Settings
- Spanning Tree Algorithm
- Congestion Control
- Class of Service
- Quality of Service
- VoIP Traffic Configuration
- Security Measures
- AAA (Authentication, Authorization and Accounting)
- Configuring User Accounts
- Web Authentication
- Network Access (MAC Address Authentication)
- Configuring HTTPS
- Configuring the Secure Shell
- Access Control Lists
- Filtering IP Addresses for Management Access
- Configuring Port Security
- Configuring 802.1X Port Authentication
- DoS Protection
- DHCP Snooping
- IPv4 Source Guard
- ARP Inspection
- Basic Administration Protocols
- Configuring Event Logging
- Link Layer Discovery Protocol
- Simple Network Management Protocol
- Configuring Global Settings for SNMP
- Setting the Local Engine ID
- Specifying a Remote Engine ID
- Setting SNMPv3 Views
- Configuring SNMPv3 Groups
- Setting Community Access Strings
- Configuring Local SNMPv3 Users
- Configuring Remote SNMPv3 Users
- Specifying Trap Managers
- Creating SNMP Notification Logs
- Showing SNMP Statistics
- Remote Monitoring
- Switch Clustering
- Setting a Time Range
- LBD Configuration
- Smart Pair Configuration
- Multicast Filtering
- Overview
- Layer 2 IGMP (Snooping and Query for IPv4)
- Configuring IGMP Snooping and Query Parameters
- Specifying Static Interfaces for a Multicast Router
- Assigning Interfaces to Multicast Services
- Setting IGMP Snooping Status per Interface
- Filtering IGMP Query Packets and Multicast Data
- Displaying Multicast Groups Discovered by IGMP Snooping
- Displaying IGMP Snooping Statistics
- Filtering and Throttling IGMP Groups
- MLD Snooping (Snooping and Query for IPv6)
- Filtering and Throttling MLD Groups
- Filtering MLD Query Packets on an Interface
- IP Tools
- IP Configuration
- General IP Routing
- Unicast Routing
- Overview
- Configuring the Routing Information Protocol
- Configuring General Protocol Settings
- Clearing Entries from the Routing Table
- Specifying Network Interfaces
- Specifying Passive Interfaces
- Specifying Static Neighbors
- Configuring Route Redistribution
- Specifying an Administrative Distance
- Configuring Network Interfaces for RIP
- Displaying RIP Interface Settings
- Displaying Peer Router Information
- Resetting RIP Statistics
- IP Services
- Appendices
- Glossary
- Index

Chapter 14
| Multicast Filtering
Layer 2 IGMP (Snooping and Query for IPv4)
– 436 –
Displaying IGMP
Snooping Statistics
Use the Multicast > IGMP Snooping > Statistics pages to display IGMP snooping
protocol-related statistics for the specified interface.
Parameters
These parameters are displayed:
◆ VLAN – VLAN identifier. (Range: 1-4094)
◆ Port – Port identifier. (Range: 1-26/52)
◆ Trunk – Trunk identifier. (Range: 1-8)
Query Statistics
◆ Other Querier – IP address of remote querier on this interface.
◆ Other Querier Expire – Time after which remote querier is assumed to have
expired.
◆ Other Querier Uptime – Time remote querier has been up.
◆ Self Querier – IP address of local querier on this interface.
◆ Self Querier Expire – Time after which local querier is assumed to have
expired.
◆ Self Querier Uptime – Time local querier has been up.
◆ General Query Received – The number of general queries received on this
interface.
◆ General Query Sent – The number of general queries sent from this interface.
◆ Specific Query Received – The number of specific queries received on this
interface.
◆ Specific Query Sent – The number of specific queries sent from this interface.
◆ Warn Rate Limit – The rate at which received query messages of the wrong
version type cause the Vx warning count to increment. Note that “0 sec” means
that the Vx warning count is incremented for each wrong message version
received.
◆ V1 Warning Count – The number of times the query version received
(Version 1) does not match the version configured for this interface.
◆ V2 Warning Count – The number of times the query version received
(Version 2) does not match the version configured for this interface.