
Web Management Guide-R05
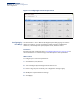
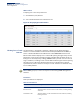
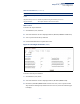
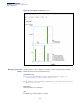
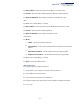
Table Of Contents
- How to Use This Guide
- Contents
- Figures
- Tables
- Getting Started
- Web Configuration
- Using the Web Interface
- Basic Management Tasks
- Displaying System Information
- Displaying Hardware/Software Versions
- Configuring Support for Jumbo Frames
- Displaying Bridge Extension Capabilities
- Managing System Files
- Setting the System Clock
- Configuring the Console Port
- Configuring Telnet Settings
- Displaying CPU Utilization
- Configuring CPU Guard
- Displaying Memory Utilization
- Resetting the System
- Using Cloud Management
- Interface Configuration
- VLAN Configuration
- Address Table Settings
- Spanning Tree Algorithm
- Congestion Control
- Class of Service
- Quality of Service
- VoIP Traffic Configuration
- Security Measures
- AAA (Authentication, Authorization and Accounting)
- Configuring User Accounts
- Web Authentication
- Network Access (MAC Address Authentication)
- Configuring HTTPS
- Configuring the Secure Shell
- Access Control Lists
- Filtering IP Addresses for Management Access
- Configuring Port Security
- Configuring 802.1X Port Authentication
- DoS Protection
- DHCP Snooping
- IPv4 Source Guard
- ARP Inspection
- Basic Administration Protocols
- Configuring Event Logging
- Link Layer Discovery Protocol
- Simple Network Management Protocol
- Configuring Global Settings for SNMP
- Setting the Local Engine ID
- Specifying a Remote Engine ID
- Setting SNMPv3 Views
- Configuring SNMPv3 Groups
- Setting Community Access Strings
- Configuring Local SNMPv3 Users
- Configuring Remote SNMPv3 Users
- Specifying Trap Managers
- Creating SNMP Notification Logs
- Showing SNMP Statistics
- Remote Monitoring
- Switch Clustering
- Setting a Time Range
- LBD Configuration
- Smart Pair Configuration
- Multicast Filtering
- Overview
- Layer 2 IGMP (Snooping and Query for IPv4)
- Configuring IGMP Snooping and Query Parameters
- Specifying Static Interfaces for a Multicast Router
- Assigning Interfaces to Multicast Services
- Setting IGMP Snooping Status per Interface
- Filtering IGMP Query Packets and Multicast Data
- Displaying Multicast Groups Discovered by IGMP Snooping
- Displaying IGMP Snooping Statistics
- Filtering and Throttling IGMP Groups
- MLD Snooping (Snooping and Query for IPv6)
- Filtering and Throttling MLD Groups
- Filtering MLD Query Packets on an Interface
- IP Tools
- IP Configuration
- General IP Routing
- Unicast Routing
- Overview
- Configuring the Routing Information Protocol
- Configuring General Protocol Settings
- Clearing Entries from the Routing Table
- Specifying Network Interfaces
- Specifying Passive Interfaces
- Specifying Static Neighbors
- Configuring Route Redistribution
- Specifying an Administrative Distance
- Configuring Network Interfaces for RIP
- Displaying RIP Interface Settings
- Displaying Peer Router Information
- Resetting RIP Statistics
- IP Services
- Appendices
- Glossary
- Index

Chapter 4
| Interface Configuration
Port Configuration
– 104 –
Web Interface
To display port connection parameters:
1. Click Interface, Port, General.
2. Select Show Information from the Action List.
Figure 33: Displaying Port Information
Showing Port or Trunk
Statistics
Use the Interface > Port/Trunk > Statistics or Chart page to display standard
statistics on network traffic from the Interfaces Group and Ethernet-like MIBs, as
well as a detailed breakdown of traffic based on the RMON MIB. Interfaces and
Ethernet-like statistics display errors on the traffic passing through each port. This
information can be used to identify potential problems with the switch (such as a
faulty port or unusually heavy loading). RMON statistics provide access to a broad
range of statistics, including a total count of different frame types and sizes passing
through each port. All values displayed have been accumulated since the last
system reboot, and are shown as counts per second. Statistics are refreshed every
60 seconds by default.
Note:
RMON groups 2, 3 and 9 can only be accessed using SNMP management
software.
Parameters
These parameters are displayed:
Table 6: Port Statistics
Parameter Description
Interface Statistics
Received Octets The total number of octets received on the interface, including framing
characters.
Transmitted Octets The total number of octets transmitted out of the interface, including
framing characters.