
Product Manual

SE-1200 Series Electrocardiograph User Manual Printing ECG Reports
- 71 -
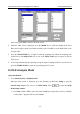
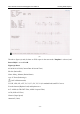
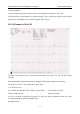
Average Template:
Average template shows the average value of 10s sampled ECG signals of every lead.
The broken lines on the template are position markers. They respectively mark the start and end
points of the P and QRS waves, and the end point of the T wave.
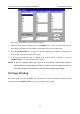
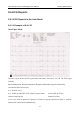
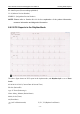
8.6.1.2 Example of 3×4+1R
The above figure shows an ECG report in the auto mode. The style is 3×4+1R. The ECG report
includes:
Patient Information, Measure Information, Diagnosis Information, Report Confirmed by
02-06-2010 16:53:52 (Current Date and Current Time)
3×4+1R ECG waves
0.67~100Hz (0.67Hz DFT Filter, 100Hz Lowpass Filter) AC50 (50Hz AC Filter)
25mm/s (Paper Speed) 10mm/mV (Gain)
4*2.5s+1r (12 leads are printed in 4 groups of 3, and every group is printed for about 2.5s, with
one rhythm lead at the bottom simultaneously)
Institution Name