
Product Manual


M3A Vital Signs Monitor User Manual Trend
- 42 -
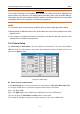
Figure 6-6 NIBP Trend Graph
You can set the items below the trend graph.
Item: you can set the display parameter to NIBP, SpO
2
or PR.
Y: it stands for the ordinate which indicates the displayed data range.
X: it stands for the abscissa which indicates the displayed time range.
After selecting the NIBP, SpO
2
or PR, the Y and X can be set as the following table shows:
Parameter Y (data range) X (time range)
SpO
2
0~100, 60~100, 80~100 30 min / 60 min / 120 min
NIBP 10~270, 20~180, 40~160 30 min / 60 min / 120 min
PR 30~300, 40~180, 40~120 30 min / 60 min / 120 min