
Product Manual


M3A Vital Signs Monitor User Manual Trend
- 40 -
Chapter 6 Trend
The monitor provides 100-hour trend data of all parameters (SYS, MAP, DIA, PR, SpO
2
, TEMP),
2-hour trend graph of NIBP/SpO
2
/PR/TEMP, storage data of 12, 000 NIBP measurement results
and 200 Patient IDs.
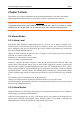
6.1 Trend List
The NIBP Multi-Group list is displayed as follows:
Figure 6-1 NIBP Multi-Group Review
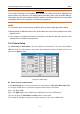
Press TREND/WAVEFORM button to change the waveform to trend list as follows:
Figure 6-2 Trend List