
User's Manual

Acclarix LX9 Series Diagnostic Ultrasound System User Manual Imaging
- 74 -
No.
Name
Description
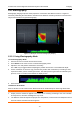
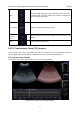
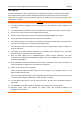
1.
Contrast cineloop window
Displays contrast cineloop and ROIs.
2.
Tissue cineloop window
Displays tissue cineloop and ROIs.
3.
ROIs
The ROI indicates sampling position of the TIC. ROIs are
color-coded, and up to 7 ROIs can be displayed.
4.
Analysis window
The TIC Analysis window displays:
Y axis represents intensity scale (dB).
X axis represents time (sec).
Time intensity curves, coded with the same color of its
sample area.
Frame marker, a white vertical line.
Time at the frame marker position.
Intensity at the frame marker position.
The active curve.
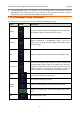
5.
TIC parameters
Displays TIC parameters of each sample area (ROI). These
parameters include:
PI (Peak Intensity): contrast peak intensity.
AT (Arrival Time): time point where contrast intensity
appears.
TTP (Time to Peak): time point where the contrast
intensity reaches peak value.
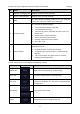
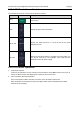
The TIC analysis touch screen displays the following controls:
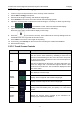
Name
Control
Description
Ellipse tool
Ellipse tool for placing ROIs on contrast image.
Trace tool
Trace tool for placing ROIs on contrast image.
TIC Chart
Show/hide TIC chart. Only available when at least one ROI
is placed on the image. The TIC chart is displayed below
the image area.
Fit Curving
Press to perform fit curving.
Delete
Removes ROIs from the image one by one.