
Use Instructions


iSE Series Electrocardiograph User Manual Editing ECGs
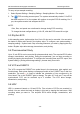
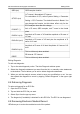
6.2 ECG Measurement/Diagnosis
Manual Measurement
To measure ECG waveform, open the waveform magnification page, and tap on the
icon in the right lower corner. A measurement pane will be displayed. Tap
once more to exit measurement.
To move the measurement pane, slide it. To move the four pane lines, tap on one line and
slide it. Slide up and down to measure amplitude (in mV), and left and right to measure
interval (in ms). Amplitude, interval, and heart rate are synchronous with line movement.
To use manual ruler, zoom in/out the waveforms in the magnification page. Move this
ruler up/down or left/right to measure amplitude and interval.
To change gain, tap on it.
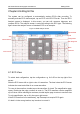
Auto Measurement
iSE provides auto measurements of HR, P wave duration, PR interval, QRS complex
duration, QT/QTc, frontal P/QRS/T axis, RV5/SV1, and RV6/SV2 on the ECG Analysis
screen. Any measurement out of the specified range will be displayed in red.
Auto Diagnosis
iSE provides auto diagnosis of ECG in the Analysis screen. Slide the diagnosis portion up
and down to see all. If serious diseases are diagnosed, they will be displayed in red.
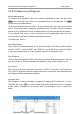
Re-analysis
ECG can be re-analyzed only when more than 10s ECG is recorded. Tap Re-analyze.
The 10s ECG waveforms from the present onset will be re-analyzed. Auto measurements
and diagnosis will be automatically updated.
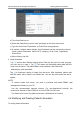
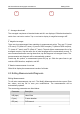
Averages View
iSE provides a Template (averaged complexes) to analyze ECG waveforms. To open
Template, tap on the icon (three vertical dots) at the right lower corner of Analysis
screen. Select Template from the pop-up menu. The Averages screen is opened as
below.
1