
User's Manual


Patient Monitor User Manual Review
- 129 -
Chapter 20 Review
The monitor provides 120-hour trend data of all parameters, storage of 1200 NIBP measurement
results and 60 alarm events. This chapter gives detailed instruction for review of all data.
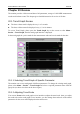
20.1 Trend Graph Review
■ The latest 1-hour trend is displayed every 1 or 5 seconds.
■
The latest 120-hour trend is displayed every 1, 5 or 10 minutes.
To review Trend Graph, please press the
Trend Graph
key on the screen or select
Menu
>
Review
>
Trend Graph
, then the trend graph interface is displayed.
In the trend graph, the y-axis stands for the measurement value and x-axis stands for the time.
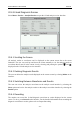
20.1.1 Selecting Trend Graph of Specific Parameter
The monitor can review trend graph of different parameters. To change the existing trend graph,
please select
Menu > Review > Trend Graph and select a required parameter name from the
popup list (as shown in red text in the above figure).
20.1.2 Adjusting Trend Scale
You can use Zoom on the trend graph review interface to adjust the trend scale. Once you adjust
the trend scale on the trend graph review interface, you also change the trend scale of the related
parameters for the screen trend displayed on the main screen.