
User's Manual
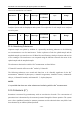
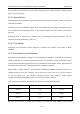
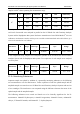
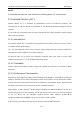
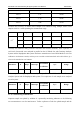
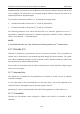
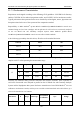
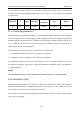
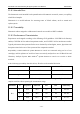
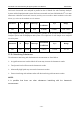
Table Of Contents
- About this Manual
- Statement
- Responsibility of the Manufacturer
- Terms Used in this Manual
- Table of Contents
- Chapter 1 Safety Guide
- Chapter 2 System Overview
- Chapter 3 Installation Guide
- Chapter 4 Setup
- Chapter 5 Patient Analyzing
- Chapter 6 Quality Control (QC) Tests
- Chapter 7 Data Management
- Chapter 8 Online Update
- Chapter 9 Troubleshooting
- Chapter 10 Cleaning, Care and Maintenance
- Chapter 11 Theory
- Chapter 12 Parameters
- Chapter 13 Warranty and Service
- Appendix 1 Specifications
- Appendix 2 Measurement Ranges
- Appendix 3 Reference Ranges
- Appendix 4 EMC Information
- Appendix 5 FCC Information
- Appendix 6 Order List

i15 Blood Gas and Chemistry Analysis System User Manual Parameters
- 137 -
Controls Mean
SD
Level 1
1.47 0.029
Level 2
1.16 0.026
Level 3
0.46 0.019
Precision and recovery on whole blood samples was estimated using multiple whole blood
samples with Ca
++
values spanning the measurement range.
Parameter N Expected Observed Swr bias %Recovery
Ca
++
9 1.05 1.05 0.03 0.00 100.0%
9 1.21 1.20 0.01 -0.01 99.2%
9 2.68 2.68 0.07 0.00 100.0%
Linearity was estimated using reference materials and reference methods. Three replicates of
each level of materials were analyzed in parallel on the i15 Blood Gas and Chemistry Analysis
System and the Rapidpoint 400 system. Reference materials used were RNA Medical
®
CVC123
Calibration Verification Controls, and they were traceable to NIST standards. In the table below, Sy.x
refers to the standard error of estimate.
Parameter N Slope Intercept
Correlation
Coefficient
Sy.x Range
Ca
++
15 0.98 0.37 0.99998 0.00972 0.15 – 3.74
In the comparison study, samples were analyzed in parallel on the i15 Blood Gas and Chemistry
Analysis System and the Rapidpoint 400 system. Two replicates of each sample were analyzed
on each system.
Parameter N Slope Intercept
Correlation
Coefficient
Sy.x Range
Ca
++
215 0.9987 0.0019 0.9910 0.0265 0.61 – 1.73
12.6.4 Interfering Substances
Aqueous sample was spiked by addition of a potentially interfering substance to the following
test concentration to test for interferences. Twelve replicates of both the spiked sample and the