
User's Manual

ANSI Electric Meter v3.1 User’s Guide 73
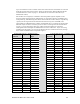
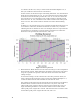
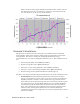
Figure 4.2 shows a line graph charting two demand values. In this scenario,
the main interval is set to 10 minutes, so values for each of the 6 intervals
are recorded at 10, 20, 30, 40, 50, and 60 minutes.
Figure 4.2 Block Demand
Demand Calculations
The previous section describes how the meter can calculate and record demand
measurements. This section describes which energy measurements can be made
using demand. The meter is capable of calculating the following energy
measurements for any of the 8 configurable demand sources. The 8 demand sources
are:
Forward energy (Fwd Active [kWh] L1+L2+L3)
Reverse energy (Rev Active [kWh] L1+L2+L3)
Forward + reverse energy (Fwd+Rev Active [kWh] L1+L2+L3)
Forward - reverse active energy (Fwd-Rev Active [kWh] L1+L2+L3)
Reactive energy for all 4 quadrants (Reactive [kvarh] Q[1..4])
The meter can measure the following measurements for any of the 8 demand sources:
Present Demand. Present demand is the demand value of the interval currently in
progress. It is updated every second. There are two ways to calculate present demand,
depending on the time value that is used to normalize the energy used in the interval.
The first measures the accumulated energy since interval start based on the time expired
since last end-of-interval, meaning that the demand value is calculated by dividing the
accumulated energy by the amount of time that has passed since the current interval
began. The second measures the accumulated energy since interval start based on the
total interval time, meaning that the demand value is calculated by dividing the
accumulated energy by the total length of the current interval (regardless of how much of
that time has expired).