
Firmware Manual


9000X AF Drives
8-6 For more information visit: www.eaton.com
MN04004001E
August 2010
Description of Parameters
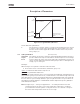
Figure 8-3: PID Controller Function as I-Controller
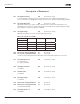
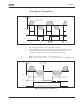
Figure 8-4: PID Output Curve with the Values of Example 2
Example 2:
Given values:
P1.1.12, P = 100%
P1.1.13, I-time = 1.00 s
P1.1.14, D-time = 1.00 s Min freq. = 0 Hz
Error value (setpoint – process value) = ±10% Max freq. = 60 Hz
As the power is switched on, the system detects the difference between the setpoint
and the actual process value and starts to either raise or decrease (in case the error
value is negative) the PID output according to the I-time. Once the difference between
the setpoint and the process value has been reduced to 0, the output is reduced by the
amount corresponding to the value of P1.1.13.
In case the error value is negative, the frequency converter reacts reducing the output
correspondingly. See Figure 8-4.
10%
10%
10%
10%
Error = 10%
PID Output
Error Value
I-Part = 5 Hz/s
I-Part = 5 Hz/s
I-Part = 5 Hz/s
I-Part = 5 Hz/s
I-Part = 5 Hz/s
1s
Hz
t
D-part
D-part
I-part
I-part
Error = 10%
Error = -10%
P-part = 5 Hz
P-part = -5 Hz
D-part
t
Hz
PID Output
Error Value