
Manual
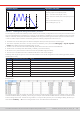
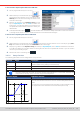

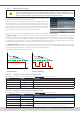
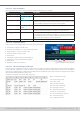

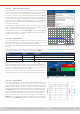
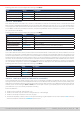
Table Of Contents
- 1. General
- 1.1 About this document
- 1.2 Warranty
- 1.3 Limitation of liability
- 1.4 Disposal of equipment
- 1.5 Product key
- 1.6 Intended usage
- 1.7 Safety
- 1.8 Technical Data
- 1.9 Construction and function
- 1.9.1 General description
- 1.9.2 Block diagram
- 1.9.3 Scope of delivery
- 1.9.4 Accessories
- 1.9.5 Options
- 1.9.6 The control panel (HMI)
- 1.9.7 USB port (rear side)
- 1.9.8 Interface module slot
- 1.9.9 Analog interface
- 1.9.10 “Share BUS” connector
- 1.9.11 “Sense” connector (remote sensing)
- 1.9.12 Master-Slave bus
- 1.9.13 Ethernet port
- 2. Installation & commissioning
- 2.1 Transport and storage
- 2.2 Unpacking and visual check
- 2.3 Installation
- 2.3.1 Safety procedures before installation and use
- 2.3.2 Preparation
- 2.3.3 Installing the device
- 2.3.4 Connection to AC supply
- 2.3.5 Connection to DC sources
- 2.3.6 Connection of remote sensing
- 2.3.7 Grounding of the DC terminal
- 2.3.8 Installation of an interface module
- 2.3.9 Connection of the analog interface
- 2.3.10 Connection of the Share bus
- 2.3.11 Connection of the USB port (rear side)
- 2.3.12 Initial commission
- 2.3.13 Commission after a firmware update or a long period of non-use
- 3. Operation and application
- 3.1 Important notes
- 3.2 Operating modes
- 3.3 Alarm conditions
- 3.4 Manual operation
- 3.5 Remote control
- 3.6 Alarms and monitoring
- 3.7 Locking the control panel (HMI)
- 3.8 Locking the adjustment limits and user profiles
- 3.9 Loading and saving user profiles
- 3.10 The function generator
- 3.10.1 Introduction
- 3.10.2 General
- 3.10.3 Method of operation
- 3.10.4 Manual operation
- 3.10.5 Sine wave function
- 3.10.6 Triangular function
- 3.10.7 Rectangular function
- 3.10.8 Trapezoidal function
- 3.10.9 DIN 40839 function
- 3.10.10 Arbitrary function
- 3.10.11 Ramp function
- 3.10.12 IU table function (XY table)
- 3.10.13 Battery test function
- 3.10.14 MPP tracking function
- 3.10.15 Remote control of the function generator
- 3.11 Other applications
- 4. Service and maintenance
- 5. Contact and support

© EA Elektro-Automatik in 2022, this information is subject to change without notice 8033200840_manual_elr_10000_2u_3kw_en_02
Following parameters can be congured for tracking mode MPP2:
Value Range Description
U
OC
(open circuit voltage) 0...U
Nom
Voltage of the unloaded solar panel, taken from the panel specs
I
SC
(short-circuit current) 0...I
Nom
Short-circuit current, taken from the panel specs
Tracking interval (Δt) 5...60000 ms Interval for measuring U and I while nding the MPP
Delta P 0...P
Nom
Tracking/regulation tolerance below the MPP
3.10.14. 3 Mode MPP3
Also called “fast track”, this mode is very similar to mode MPP2, but without the initial step which is used to nd the actual
MPP, because mode MPP3 would directly jump to the power point dened by user input (U
MPP
, P
MPP
). In case the MPP values
of the equipment under test are known, this can save a lot of time in repetitive tests. The rest of the function run is the same
as with MPP2 mode. During and after the function, the least acquired MPP values of voltage (U
MPP
), current (I
MPP
) and power
(P
MPP
) are shown in the display.
Following parameters can be congured for tracking mode MPP3:
Value Range Description
U
OC
(open circuit voltage) 0...U
Nom
Voltage of the unloaded solar panel, taken from the panel specs
I
SC
(short-circuit current) 0...I
Nom
Short-circuit current, taken from the panel specs
U
MPP
(max. power point) 0...U
Nom
Voltage in the MPP
P
MPP
(max. power point) 0...P
Nom
Power in the MPP
Tracking interval (Δt) 5...60000 ms Interval for measuring U and I while nding the MPP
Delta P 0...P
Nom
Tracking/regulation tolerance below the MPP
3.10.14. 4 Mode MPP4
This mode is different to the others, because it does not track automatically. It rather offers the choice to dene a user curve
by setting up to 100 points of voltage values, then track this curve, measure current and power and return the results in up to
100 sets of acquired data. The curve points can only be loaded from a USB stick. Start and end point can be adjusted as well,
Δt denes the time between two points and the function run can be repeated up to 65535 times. Once the function stops at
the end or due to manual interrupt, the DC input is switched off and the measured data is made available. After the function,
the acquired set of data with the highest actual power will be shown in the display as voltage (U
MPP
), current (I
MPP
) and power
(P
MPP
) of the MPP. Going back on the screen with Back then allows for data export of the 100 measured results to USB stick.
Following parameters can be congured for tracking mode MPP4:
Value Range Description
Start 1...End Start point for the run of x out of 100 subsequent points
End Start...100 End point for the run of x out of 100 subsequent points
Repetitions 0...65535 Number of repetitions for the run from Start to End
Tracking interval (Δt) 5...60000 ms Time before the next point
3.10.14. 5 Load curve data from USB stick for mode MPP4
Curve point data (only one voltage value per point), in form of a CSV le, is loaded from USB stick. See section
1.9.6.5
for the
naming convention. Contrary to manual adjustment where you can dene and use an arbitrary number of points, loading from
USB requires the CSV le to always contain the full number of points (100), because it can’t dene which one is start and end.
However, the on-screen setting for Start and End point remain valid. It means, if you actually want to use all 100 points from
your loaded curve, you must set the parameters according.
File format denition:
• The le must be a text le with appendix *.csv
• The le must contain only one column of voltage values (0... rated voltage)
• The le must exactly 100 values in 100 rows, no gaps
• The decimal separator of broken values must follow the setting “Log le separator format” where selection US means dot
as decimal separator and selection Standard means comma