
Manual
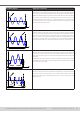
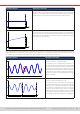
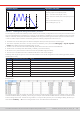
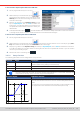

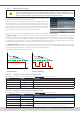
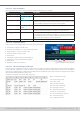

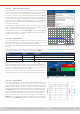
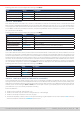
Table Of Contents
- 1. General
- 1.1 About this document
- 1.2 Warranty
- 1.3 Limitation of liability
- 1.4 Disposal of equipment
- 1.5 Product key
- 1.6 Intended usage
- 1.7 Safety
- 1.8 Technical Data
- 1.9 Construction and function
- 1.9.1 General description
- 1.9.2 Block diagram
- 1.9.3 Scope of delivery
- 1.9.4 Accessories
- 1.9.5 Options
- 1.9.6 The control panel (HMI)
- 1.9.7 USB port (rear side)
- 1.9.8 Interface module slot
- 1.9.9 Analog interface
- 1.9.10 “Share BUS” connector
- 1.9.11 “Sense” connector (remote sensing)
- 1.9.12 Master-Slave bus
- 1.9.13 Ethernet port
- 2. Installation & commissioning
- 2.1 Transport and storage
- 2.2 Unpacking and visual check
- 2.3 Installation
- 2.3.1 Safety procedures before installation and use
- 2.3.2 Preparation
- 2.3.3 Installing the device
- 2.3.4 Connection to AC supply
- 2.3.5 Connection to DC sources
- 2.3.6 Connection of remote sensing
- 2.3.7 Grounding of the DC terminal
- 2.3.8 Installation of an interface module
- 2.3.9 Connection of the analog interface
- 2.3.10 Connection of the Share bus
- 2.3.11 Connection of the USB port (rear side)
- 2.3.12 Initial commission
- 2.3.13 Commission after a firmware update or a long period of non-use
- 3. Operation and application
- 3.1 Important notes
- 3.2 Operating modes
- 3.3 Alarm conditions
- 3.4 Manual operation
- 3.5 Remote control
- 3.6 Alarms and monitoring
- 3.7 Locking the control panel (HMI)
- 3.8 Locking the adjustment limits and user profiles
- 3.9 Loading and saving user profiles
- 3.10 The function generator
- 3.10.1 Introduction
- 3.10.2 General
- 3.10.3 Method of operation
- 3.10.4 Manual operation
- 3.10.5 Sine wave function
- 3.10.6 Triangular function
- 3.10.7 Rectangular function
- 3.10.8 Trapezoidal function
- 3.10.9 DIN 40839 function
- 3.10.10 Arbitrary function
- 3.10.11 Ramp function
- 3.10.12 IU table function (XY table)
- 3.10.13 Battery test function
- 3.10.14 MPP tracking function
- 3.10.15 Remote control of the function generator
- 3.11 Other applications
- 4. Service and maintenance
- 5. Contact and support

© EA Elektro-Automatik in 2022, this information is subject to change without notice 7133200840_manual_elr_10000_2u_3kw_en_02
Schematic diagram: Applications and results:
Start (DC)
t
U,I
Seq.time
End ( DC)
Example 1: Focusing 1 cycle of 1 sequence point:
DC values for start and end are the same, also the AC amplitude. With a
frequency >0 Hz a sine wave progression of the set value is generated with a
dened amplitude, frequency and Y axis offset (DC values for start and end).
The number of sine waves per cycle depends on the sequence point time
and the frequency. If the time was 1 s and the frequency 1Hz, there would
be exactly one sine wave. If the time was 0.5 s at the same frequency, there
would only be a half sine wave.
Start (DC)
t
U,I
Seq.time
End ( DC)
Example 2: Focusing 1 cycle of 1 sequence point:
The DC values at start and end are the same but those of the amplitude
aren’t. The end value is higher than the start value so the amplitude increases
with each new half sine wave continuously over the sequence point time.
This, of course, only if time and frequency allow for multiple waves to be
created. For instance, with f=1 Hz and time = 3 s, three full waves would be
generated, if the angle is 0°, and reciprocally the same for f=3 s and time=1 s.
Start (DC)
t
U,I
Start (AC) En d (AC)
Seq.time
End ( DC)
Start (DC)
t
U,I
Start (AC) En d (AC)
Seq.time
End ( DC)
Example 3: Focusing 1 cycle of 1 sequence point:
The DC values at start and end are not equal, as well as the AC start and
end values. In both cases the end value is higher than the start value so
that offset increases over time, but also the amplitude with each new half
sine wave.
Additionally, the rst sine wave starts with a negative half wave because the
angle has been set to 180°. The start angle can be shifted at will in steps
of 1° between 0° and 359°.
Start (DC)
t
U,I
f (start)
f (end)
Seq.time
End ( DC)
Example 4: Focusing 1 cycle of 1 sequence point:
Similar to example 1 but with a different end frequency. Here this is shown
as higher than the start frequency. This impacts the period of the sine
waves such that each new wave will be shorter over the total span of the
sequence time.