
Manual
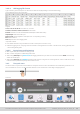
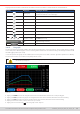
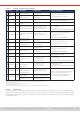
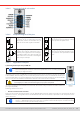
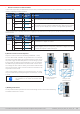
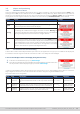
Table Of Contents
- 1. General
- 1.1 About this document
- 1.2 Warranty
- 1.3 Limitation of liability
- 1.4 Disposal of equipment
- 1.5 Product key
- 1.6 Intended usage
- 1.7 Safety
- 1.8 Technical Data
- 1.9 Construction and function
- 1.9.1 General description
- 1.9.2 Block diagram
- 1.9.3 Scope of delivery
- 1.9.4 Accessories
- 1.9.5 Options
- 1.9.6 The control panel (HMI)
- 1.9.7 USB port (rear side)
- 1.9.8 Interface module slot
- 1.9.9 Analog interface
- 1.9.10 “Share BUS” connector
- 1.9.11 “Sense” connector (remote sensing)
- 1.9.12 Master-Slave bus
- 1.9.13 Ethernet port
- 2. Installation & commissioning
- 2.1 Transport and storage
- 2.2 Unpacking and visual check
- 2.3 Installation
- 2.3.1 Safety procedures before installation and use
- 2.3.2 Preparation
- 2.3.3 Installing the device
- 2.3.4 Connection to AC supply
- 2.3.5 Connection to DC sources
- 2.3.6 Connection of remote sensing
- 2.3.7 Grounding of the DC terminal
- 2.3.8 Installation of an interface module
- 2.3.9 Connection of the analog interface
- 2.3.10 Connection of the Share bus
- 2.3.11 Connection of the USB port (rear side)
- 2.3.12 Initial commission
- 2.3.13 Commission after a firmware update or a long period of non-use
- 3. Operation and application
- 3.1 Important notes
- 3.2 Operating modes
- 3.3 Alarm conditions
- 3.4 Manual operation
- 3.5 Remote control
- 3.6 Alarms and monitoring
- 3.7 Locking the control panel (HMI)
- 3.8 Locking the adjustment limits and user profiles
- 3.9 Loading and saving user profiles
- 3.10 The function generator
- 3.10.1 Introduction
- 3.10.2 General
- 3.10.3 Method of operation
- 3.10.4 Manual operation
- 3.10.5 Sine wave function
- 3.10.6 Triangular function
- 3.10.7 Rectangular function
- 3.10.8 Trapezoidal function
- 3.10.9 DIN 40839 function
- 3.10.10 Arbitrary function
- 3.10.11 Ramp function
- 3.10.12 IU table function (XY table)
- 3.10.13 Battery test function
- 3.10.14 MPP tracking function
- 3.10.15 Remote control of the function generator
- 3.11 Other applications
- 4. Service and maintenance
- 5. Contact and support

© EA Elektro-Automatik in 2022, this information is subject to change without notice 5333200840_manual_elr_10000_2u_3kw_en_02
Tapping a button activates or deactivates the feature. Buttons with black on white indicate an activated feature:
Symbol Belongs to Meaning or function
USB logging
USB logging is running (the symbol is only available when USB logging
has been activated in menu “Settings”)
Master-slave Master-slave activated, device is master
Master-slave Master-slave activated, device is slave
Master-slave Master-slave deactivated
Resistance mode R mode = on
HMI Alarm sound = on
HMI Key sound = on
HMI Opens the graph screen
Operation modes
Switches voltage controller speed between Slow, Normal (default)
and Fast (see
3.2.5
)
HMI Adjust backlight intensity
HMI Opens the main menu
3. 4 .10 The graph
The devices feature a manually callable, HMI operated visual depiction of the temporal run of the actual values of voltage,
current and power, called the graph. It isn’t a recording feature whatsoever. For data recording in the background there is still
the USB logging feature (see
3.4.8
).
In normal operation the graph can be called anytime via the quick menu, while in function generator operation it’s called by
an extra screen button. Once called, it completely lls the screen.
Limited control options available while the graph is up! For safety reasons it’s, however, possible to switch
off the DC input anytime.
Overview:
Controls:
• Tapping the middle of the three red/green/blue touch areas deactivates/activate the corresponding plot
• Tapping the sides (arrows left/right) of the red/green/blue touch areas increases/decreases the vertical scaling
• Tapping the sides (arrows left/right) of the black touch area increases/decreases the horizontal scaling
• Swiping on the three scales (Y axis) moves them up or down
• Tapping the menu touch area ( ) exits the graph screen anytime