
Owner manual


Chapter 9 Viewing Files and Reports
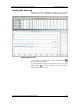
Viewing Waveforms
180 PowerSmart Socket Power Quality Meter
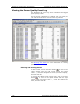
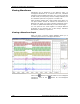
Viewing a Frequency Plot
Click on the button to view a cycle-by-cycle frequency plot
for the sampled voltage waveforms.
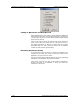
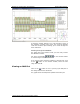
Viewing a Spectrum Chart
Click on the
button to view a spectrum chart for the
selected waveform channel. Power Software provides voltage,
current, active power and reactive power spectrum charts.
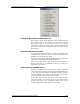
To change a channel, click on the window with the right
mouse button, select “Channels...”, check the channel you
want displayed, and then click OK.
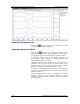
Spectrum components are calculated over four cycles of the
waveform from the point where the left marker line is
located. If more than one view are open, Power Software
gives the priority to the overlapped waveform view.
The order of the highest displayed harmonic component is
equal to the half sampling rate at which the waveforms are
sampled minus one.
Power Software can also give you indication on whether
harmonic levels in the sampled waveforms exceed
compliance limits defined by the power quality standards or
local regulations.