
User's Manual


‐
32‐
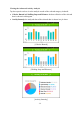
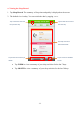
Viewing the Advanced Activity Analysis
Tap the respective tab to view the analysis results of the selected category in details.
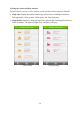
• Calories Burned and Walking Steps and Distance: the data collection of the selected
date is shown in a histogram.
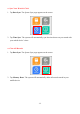
• Activity Intensity: the analyzed data of the selected date is shown in a pie chart.
[Calories Burned]
[Walking Steps and Distance]
[Activity Intensity]