
Manual
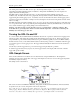
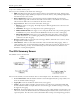
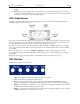
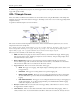
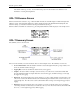
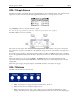
Table Of Contents
- Quick Start
- Overview
- Connecting the Logger to Your PC
- Setting Up the Logger To Record Data
- Custom Interval Setup
- Alarm Setup
- Using the Software to Check Logger Status
- Ending the Logging Session
- Powering Down the Logger
- Loading Logger Data
- Automatic Data Retrieval
- Working With the Data Graph
- Using the Zoom Feature
- Data Listing Window
- Data Summary and Statistics
- Using the Data Filter
- Hiding or Viewing Channels
- Exporting Logger Data
- Printing the Logger Data
- Calibrating the Logger
- Setting the Calibration Password
- Setting the Logger Real Time Clock
- Data Security
- Specifications
- MTL-30 Temperature Humidity Logger
- MTL-30 Logger Status LED
- Replacing the MTL-30 Battery
- MTL-30 Specifications
- MTL-20 Temperature Logger
- MTL-20 Logger Status LED
- Replacing the MTL-20 Battery
- MTL-20 Specifications
- GDL Temperature Humidity Logger with Display
- Turning the GDL On and Off
- GDL Sample Screen
- The GDL Summary Screen
- GDL Graph Screen
- GDL Buttons
- Replacing the GDL Battery
- GDL Specifications
- GDL-T Four Temperature Logger with Display
- Turning the GDL-T On and Off
- GDL-T Sample Screen
- GDL-T Difference Screen
- GDL-T Summary Screen
- GDL-T Graph Screen
- GDL-T Buttons
- Replacing the GDL-T Battery
- GDL-T Specifications
- MTL-LCD Loggers with Display
- MTL-LCD Display and Button
- Replacing the MTL-LCD Battery
- MTL-20-LCD Specifications
- MTL-30-LCD Specifications
DwyerLog User’s Guide Version 1.4x 30/33
GDL-T Graph Screen
The GDL-T is capable of displaying the logged data graphically to show temperature trends. Two channels can be
displayed at one time. The user can select the graphed channels in the Select Graph Channels screen:
Use the Display + button to select the channels to graph.
Note that only the logged channels (channels recorded in logger memory) can be graphed.
The GDL-T Graph screen is shown below.
This screen shows the graph of the samples stored in logger memory. The solid line corresponds to the left axis.
The dotted line corresponds to the right axis. The graph time stamps are shown on the left and on the right, above
the axis.
For instance, in the graph above, data collected between August 1st, 2009, 1:45 PM and August 2nd, 11:30 AM is
shown. The graph Internal Temperature T0 range is between 75° F and 83° F. The T1 range is between 30° F and
54° F.
When in the graph screen, you can use the Display - and Display + buttons to shift the graph left and right,
respectively. Pressing and holding the Start button, while in the graph screen, returns the graph view to the last
sample taken.
When the logger is logging, the graph display is automatically updated as new samples are logged.
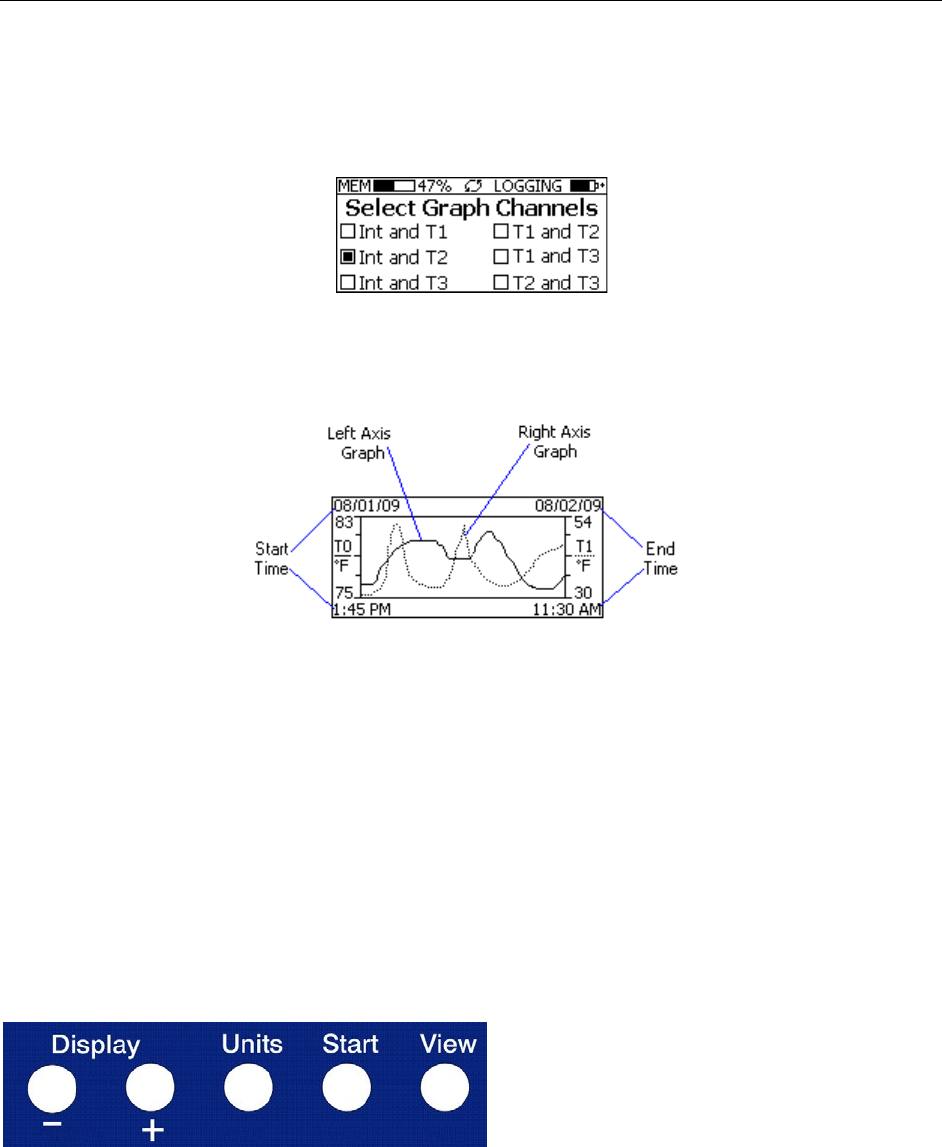
GDL-T Buttons
The GDL-T has five buttons as shown below.
• Units: Use this button to change the displayed units between ° F and ° C.
• View: Use this button to change the displayed screen.
• Start: If the logger has been setup to start on button press, press and hold the Start button to begin
logging. In the Graph screen, pressing and holding this button returns the view to the last sample logged.