
Manual
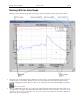
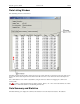
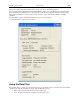
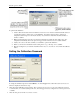
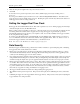
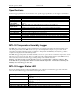
Table Of Contents
- Quick Start
- Overview
- Connecting the Logger to Your PC
- Setting Up the Logger To Record Data
- Custom Interval Setup
- Alarm Setup
- Using the Software to Check Logger Status
- Ending the Logging Session
- Powering Down the Logger
- Loading Logger Data
- Automatic Data Retrieval
- Working With the Data Graph
- Using the Zoom Feature
- Data Listing Window
- Data Summary and Statistics
- Using the Data Filter
- Hiding or Viewing Channels
- Exporting Logger Data
- Printing the Logger Data
- Calibrating the Logger
- Setting the Calibration Password
- Setting the Logger Real Time Clock
- Data Security
- Specifications
- MTL-30 Temperature Humidity Logger
- MTL-30 Logger Status LED
- Replacing the MTL-30 Battery
- MTL-30 Specifications
- MTL-20 Temperature Logger
- MTL-20 Logger Status LED
- Replacing the MTL-20 Battery
- MTL-20 Specifications
- GDL Temperature Humidity Logger with Display
- Turning the GDL On and Off
- GDL Sample Screen
- The GDL Summary Screen
- GDL Graph Screen
- GDL Buttons
- Replacing the GDL Battery
- GDL Specifications
- GDL-T Four Temperature Logger with Display
- Turning the GDL-T On and Off
- GDL-T Sample Screen
- GDL-T Difference Screen
- GDL-T Summary Screen
- GDL-T Graph Screen
- GDL-T Buttons
- Replacing the GDL-T Battery
- GDL-T Specifications
- MTL-LCD Loggers with Display
- MTL-LCD Display and Button
- Replacing the MTL-LCD Battery
- MTL-20-LCD Specifications
- MTL-30-LCD Specifications
DwyerLog User’s Guide Version 1.4x 14/33
displayed are: Minimum value, maximum value, average value (mean) and standard deviation.
For temperature channels Mean Kinetic Temperature (MKT) is displayed as well. MKT is used in pharmaceutical
and food industries as a simplified way of expressing the overall effects of temperature fluctuation during storage
and transit of perishable goods. The software uses the activation energy value H = 83.144 KJ/mol for MKT
calculation.
The data statistics are also included when data is exported to a text or Excel file.
A typical Data Summary window is shown below.
Using the Data Filter
The data filter helps to display only relevant information in the data listing window. It can also decrease the number
of printed pages when the data listing is printed. The data filter allows you to:
• Hide sample points when the data did not change sufficiently.
• Show only data points that were sampled in a specified time period.