
Manual
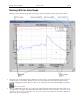
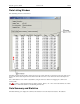
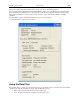
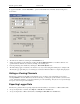
Table Of Contents
- Quick Start
- Overview
- Connecting the Logger to Your PC
- Setting Up the Logger To Record Data
- Custom Interval Setup
- Alarm Setup
- Using the Software to Check Logger Status
- Ending the Logging Session
- Powering Down the Logger
- Loading Logger Data
- Automatic Data Retrieval
- Working With the Data Graph
- Using the Zoom Feature
- Data Listing Window
- Data Summary and Statistics
- Using the Data Filter
- Hiding or Viewing Channels
- Exporting Logger Data
- Printing the Logger Data
- Calibrating the Logger
- Setting the Calibration Password
- Setting the Logger Real Time Clock
- Data Security
- Specifications
- MTL-30 Temperature Humidity Logger
- MTL-30 Logger Status LED
- Replacing the MTL-30 Battery
- MTL-30 Specifications
- MTL-20 Temperature Logger
- MTL-20 Logger Status LED
- Replacing the MTL-20 Battery
- MTL-20 Specifications
- GDL Temperature Humidity Logger with Display
- Turning the GDL On and Off
- GDL Sample Screen
- The GDL Summary Screen
- GDL Graph Screen
- GDL Buttons
- Replacing the GDL Battery
- GDL Specifications
- GDL-T Four Temperature Logger with Display
- Turning the GDL-T On and Off
- GDL-T Sample Screen
- GDL-T Difference Screen
- GDL-T Summary Screen
- GDL-T Graph Screen
- GDL-T Buttons
- Replacing the GDL-T Battery
- GDL-T Specifications
- MTL-LCD Loggers with Display
- MTL-LCD Display and Button
- Replacing the MTL-LCD Battery
- MTL-20-LCD Specifications
- MTL-30-LCD Specifications
DwyerLog User’s Guide Version 1.4x 13/33
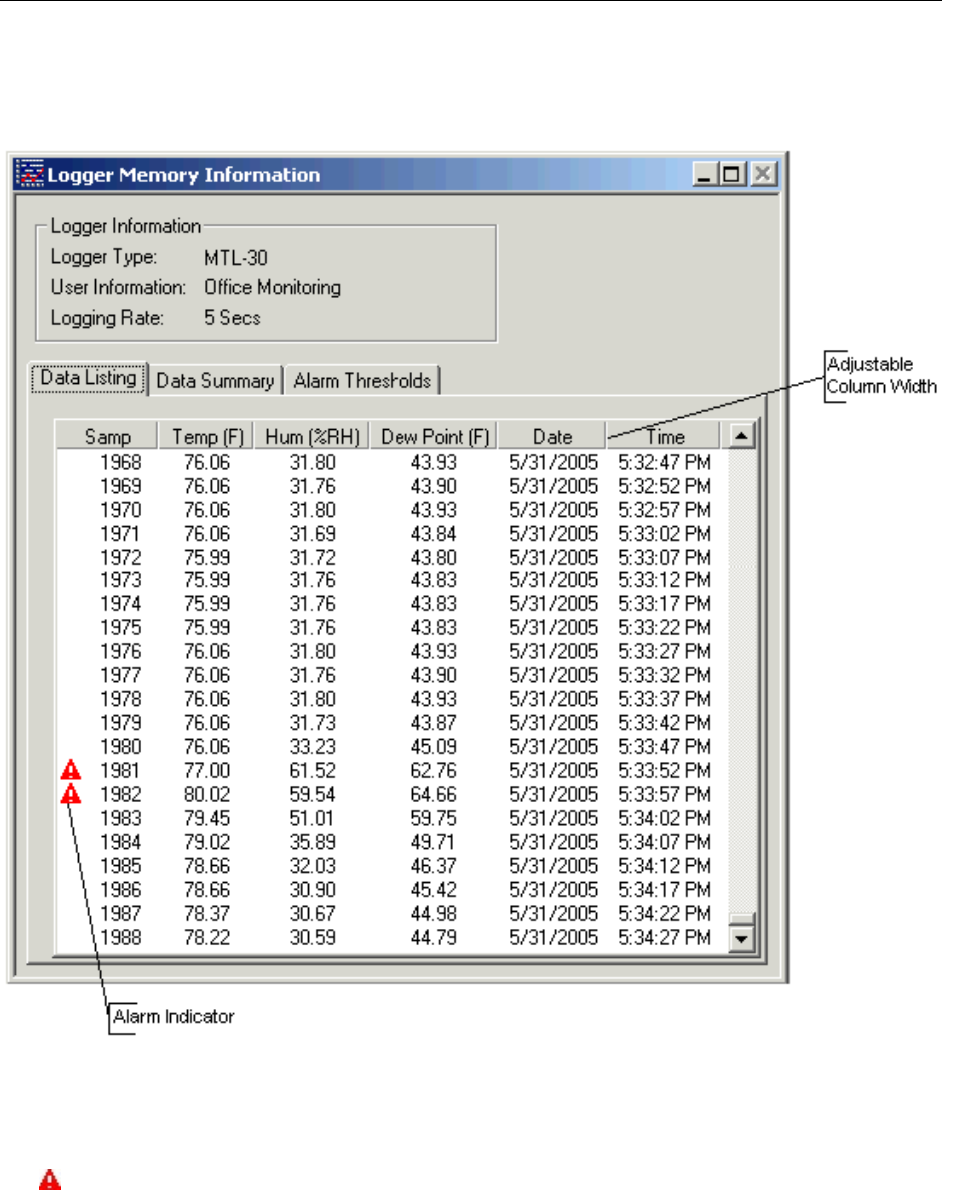
Data Listing Window
The data listing window is shown below.
The Data pane lists the data samples collected by the logger. If the data rollover check box in the setup window was
cleared, the earliest data samples are listed. If the data rollover check box was checked, the latest data samples are
listed.
The column width of each column is adjustable by using the left mouse button and dragging the column to the
desired width.
The
icon next to a data sample indicates an alarm condition. That is, one or more of the data channels are outside
the minimum or maximum (alarm low and alarm high) thresholds.
Data Summary and Statistics
The Data Summary pane displays the summary and statistics for the currently loaded dataset. The statistics