
Manual
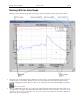
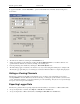
Table Of Contents
- Quick Start
- Overview
- Connecting the Logger to Your PC
- Setting Up the Logger To Record Data
- Custom Interval Setup
- Alarm Setup
- Using the Software to Check Logger Status
- Ending the Logging Session
- Powering Down the Logger
- Loading Logger Data
- Automatic Data Retrieval
- Working With the Data Graph
- Using the Zoom Feature
- Data Listing Window
- Data Summary and Statistics
- Using the Data Filter
- Hiding or Viewing Channels
- Exporting Logger Data
- Printing the Logger Data
- Calibrating the Logger
- Setting the Calibration Password
- Setting the Logger Real Time Clock
- Data Security
- Specifications
- MTL-30 Temperature Humidity Logger
- MTL-30 Logger Status LED
- Replacing the MTL-30 Battery
- MTL-30 Specifications
- MTL-20 Temperature Logger
- MTL-20 Logger Status LED
- Replacing the MTL-20 Battery
- MTL-20 Specifications
- GDL Temperature Humidity Logger with Display
- Turning the GDL On and Off
- GDL Sample Screen
- The GDL Summary Screen
- GDL Graph Screen
- GDL Buttons
- Replacing the GDL Battery
- GDL Specifications
- GDL-T Four Temperature Logger with Display
- Turning the GDL-T On and Off
- GDL-T Sample Screen
- GDL-T Difference Screen
- GDL-T Summary Screen
- GDL-T Graph Screen
- GDL-T Buttons
- Replacing the GDL-T Battery
- GDL-T Specifications
- MTL-LCD Loggers with Display
- MTL-LCD Display and Button
- Replacing the MTL-LCD Battery
- MTL-20-LCD Specifications
- MTL-30-LCD Specifications
DwyerLog User’s Guide Version 1.4x 11/33
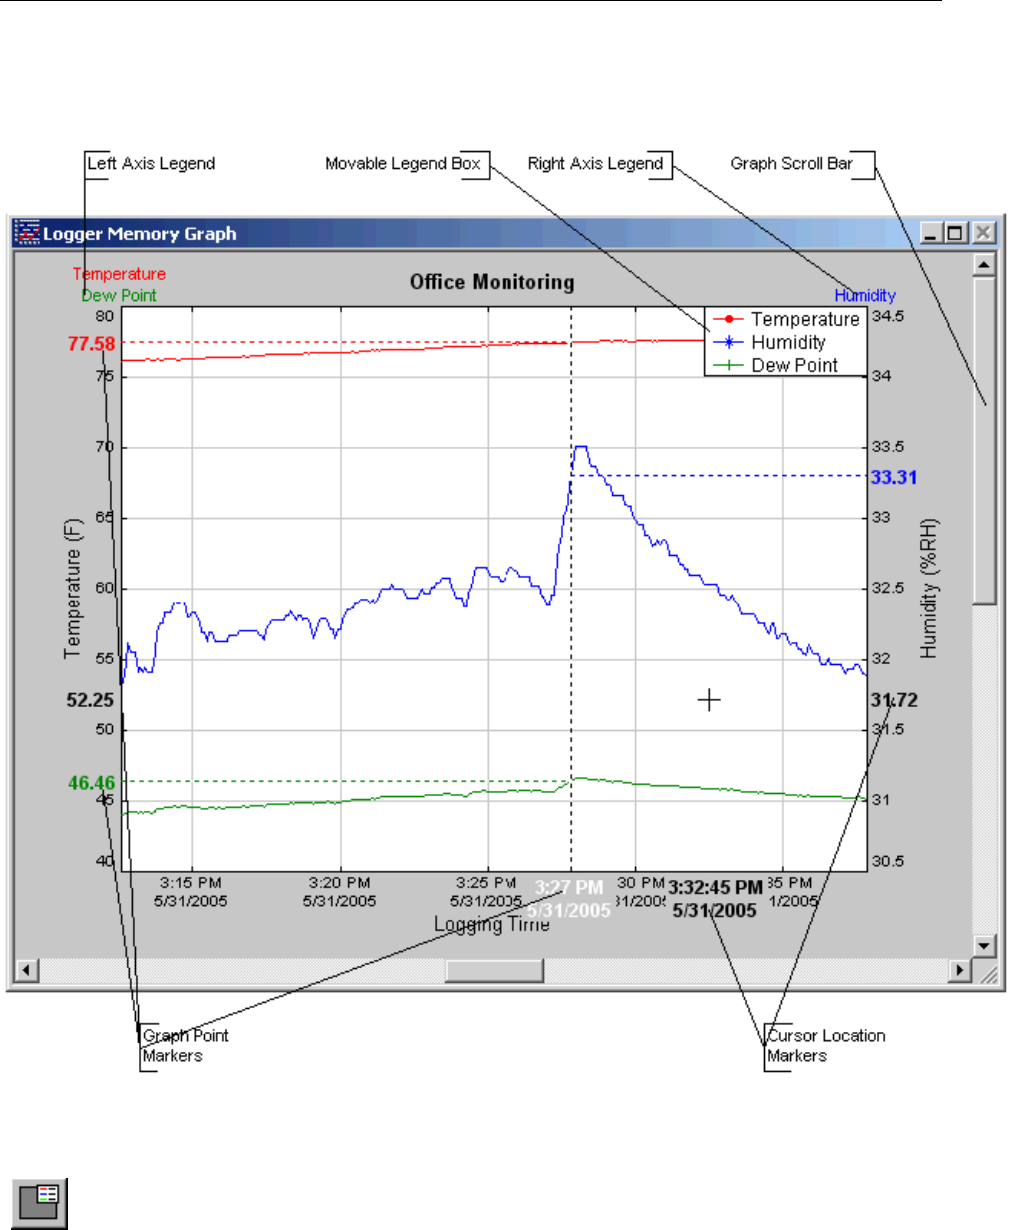
Working With the Data Graph
Clicking anywhere within the graph window activates the graph toolbar buttons and the graph window features.
• The graph plots each data channel using a different color and dot style. A small rectangular legend shows the color
and the dot style of each channel. This legend can be moved by clicking the left mouse button while inside the
legend and dragging the legend to where you want it to be. The legend can be turned ON and OFF by pressing the
button on the toolbar.
• There is an additional legend above each of the Y axis. This legend is the channel name drawn in the same color as
the channel line on the graph. This legend helps identify which channel belongs to which axis. For instance, in the
graph above, the Temperature in red and Dew Point in green correspond to the left Y axis, the Relative Humidity in
blue corresponds to the right Y axis.