DwyerLog Logger Interface Software USER’S GUIDE Version 1.4x March 21, 2013 Dwyer Instruments, Inc 102 Indiana Hwy 212 Michigan City, IN 46360 Phone: (219) 879-8868 Fax: (219) 872-9057 http://www.dwyer-inst.
Quick Start ................................................................................................................... 4 Overview...................................................................................................................... 4 Connecting the Logger to Your PC .............................................................................. 4 Setting Up the Logger To Record Data ........................................................................ 5 Custom Interval Setup .....
GDL Temperature Humidity Logger with Display ....................................................... 22 Turning the GDL On and Off ...................................................................................... 23 GDL Sample Screen .................................................................................................. 23 The GDL Summary Screen ........................................................................................ 24 GDL Graph Screen .......................................
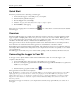
DwyerLog User’s Guide Version 1.4x 4/33 Quick Start Follow the procedure below to start using your data logger: 1. Connect the data logger to a free USB port on your computer. 2. Start the DwyerLog Interface Program. 3. From the Logger menu, select Setup. 4. Select the "Logging starts immediately when setup is complete" option. 5. Click Continue to start logging. The logger is now logging data. You can click on the has been logged.
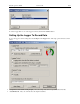
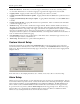
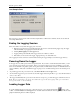
DwyerLog User’s Guide Version 1.4x 5/33 To select a logger click on one of the loggers on the list, and click the Connect button. Setting Up the Logger To Record Data To set your logger to start recording data, select Setup from the Logger menu. The setup options window is shown below. • Sample Interval (Total Recording Length): Select the sample interval from a predefined list of intervals. • Custom Interval: Add your own interval to the sample interval list.
DwyerLog User’s Guide • Version 1.4x 6/33 Enable Data Rollover: Check this box to have the logger continuously record the data, overwriting earliest recorded data. When this box is not checked, logging is stopped when the logger memory becomes full. • Logging Control: Logging can start in three ways depending on the selection you make: • Logging starts when the Start button is pushed: Logging will start when the Start button is pushed for about 3 seconds.
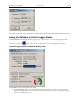
DwyerLog User’s Guide Version 1.4x 7/33 The checkbox to the left of the low/high alarms enables the alarm when checked, and disables the alarm when clear. Using the Software to Check Logger Status Selecting Status from the Logger menu brings up the Logger Status window. You can also bring up the status window by pressing the button on the toolbar.
DwyerLog User’s Guide o o o o o o o o Version 1.4x 8/33 Idle, waiting for setup: The logger is not logging. It is waiting for a setup from the user. The logger's real time clock is active in this mode. Logging will start on button press: Logging has been setup to start when the logger's Start button is pressed. Logging will start at xxxx: Delayed logging. Logging has been selected to start at a future time. The logger is waiting for this time to arrive to start logging.
DwyerLog User’s Guide Version 1.4x 9/33 Last Sample Pane The Last Sample pane shows the value of the last sample taken, for all the active channels. It also shows when the next sample will be taken. Ending the Logging Session There are a number of ways that the logging session can end: 1. When the logger memory becomes full, and data rollover was not selected during logger setup, the logger will automatically stop logging and enter the idle state. 2. Selecting End Logging from the Logger menu. 3.
DwyerLog User’s Guide Version 1.4x 10/33 Logged data can be retrieved from the logger at any time. You do not have to stop the logging session to retrieve the data. The graph display will be blank if there are less than two data points logged. The listing window will be blank if there are no data points logged (as can happen during delayed logging, or when logging is set to start on button press).
DwyerLog User’s Guide Version 1.4x 11/33 Working With the Data Graph Clicking anywhere within the graph window activates the graph toolbar buttons and the graph window features. • The graph plots each data channel using a different color and dot style. A small rectangular legend shows the color and the dot style of each channel. This legend can be moved by clicking the left mouse button while inside the legend and dragging the legend to where you want it to be.
DwyerLog User’s Guide • Version 1.4x 12/33 The Cursor Location Markers show the cursor position on the graph. The position is shown on each of the axis in a slightly larger, bold text. The position indicators can be turned ON and OFF by pressing the toolbar button on the • button activates the sample marker function. When this function is active, clicking a point on Clicking the the graph, marks this point, and shows the point values for all channels, at the specified time.
DwyerLog User’s Guide Version 1.4x 13/33 Data Listing Window The data listing window is shown below. The Data pane lists the data samples collected by the logger. If the data rollover check box in the setup window was cleared, the earliest data samples are listed. If the data rollover check box was checked, the latest data samples are listed. The column width of each column is adjustable by using the left mouse button and dragging the column to the desired width.
DwyerLog User’s Guide Version 1.4x 14/33 displayed are: Minimum value, maximum value, average value (mean) and standard deviation. For temperature channels Mean Kinetic Temperature (MKT) is displayed as well. MKT is used in pharmaceutical and food industries as a simplified way of expressing the overall effects of temperature fluctuation during storage and transit of perishable goods. The software uses the activation energy value H = 83.144 KJ/mol for MKT calculation.
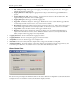
DwyerLog User’s Guide Version 1.4x 15/33 To apply the data filter, select the Data Filter… option from the View menu. The filter selection dialog box is shown below. • The filter can be disabled by checking the “No Data Filter” box. • Sample range filtering can be disabled by checking the “Don’t limit using xxxx” box for all the channels or for specific channels. Channels are selected by clicking on the channel pane. • Date range filtering can be disabled by checking the “Don’t Limit By Date” box.
DwyerLog User’s Guide Version 1.4x 16/33 The file exported to Microsoft Excel is an Excel .csv file. The easiest way to open this file in Excel is to just double click on the created file. The file can also be opened from within Microsoft Excel: 1. From the Microsoft Excel application choose Open… from the File menu. 2. In the Open window, under Files of type:, select Text Files (*.prn, *.txt, *.csv). 3. Navigate to the directory where you saved the exported file.
DwyerLog User’s Guide Version 1.4x 17/33 To perform the calibration: 1. Select a stable and accurate reference instrument. It is best to use a reference instrument that has at least 2 to 4 times the accuracy of the logger you are calibrating. For instance, if the accuracy of the logger temperature channel is given as +/-1ºF, the accuracy of your reference instrument should be at least +/0.5ºF to +/-0.25ºF. 2. Make sure that both the logger and your reference instrument are reading the same stable source.
DwyerLog User’s Guide • • Version 1.4x 18/33 Enter the new password again in the “Repeat New Password” box. Click OK. You can also remove password protection (restore factory default empty password) by checking “Remove Password”. If you forgot the calibration password and need to reset it, click the Forgot Password button. This will reset the logger password to factory default (empty password).
DwyerLog User’s Guide Version 1.4x 19/33 Specifications Common logger specifications are shown below. For specific logger specification, see the logger documentation. PC Interface Sampling Interval Data Security Operating System Compatibility Minimum System Requirements Recording Start Recording Mode Real Time Status User Calibration User Information Logger Channels Units Data Format USB port. USB cable is included User selectable from 1 second to 18 hours, in 1 second increments.
DwyerLog User’s Guide Version 1.4x 20/33 Replacing the MTL-30 Battery The battery level of the MTL-30 can be checked using the DwyerLog software, by opening the Logger Status window. It is suggested that the battery is replaced when the battery level reaches yellow. When the battery level reaches red, it is imperative that the battery is replaced as soon as possible. When the battery level is too low, the logger will stop logging automatically, resulting in data not being recorded.
DwyerLog User’s Guide Version 1.4x 21/33 MTL-30 Specifications Sample Point Capacity Alarms Calibration Operating Temperature Storage Temperature Time Accuracy Relative Humidity Range Relative Humidity Accuracy Relative Humidity Resolution Temperature Accuracy Temperature Resolution Dimensions Weight Power Source Battery Life (average use) 43,344 points for temperature only. 21,672 points for temperature, humidity and dew point. Visual over and under alarm indicator for temperature and humidity.
DwyerLog User’s Guide Version 1.4x 22/33 warning if you try to start a logging session while the battery is low. To replace the battery follow these steps: 1. Disconnect the logger from the USB cable. Do not replace the battery while the USB cable is connected! 2. Using a screwdriver, remove the screw in the back of the logger. 3. Remove the logger from the case. 4.
DwyerLog User’s Guide Version 1.4x 23/33 surrounding environment. The GDL can store up to 43,344 temperature samples, or up to 21,672 of both temperature and relative humidity samples. In addition to Temperature and Humidity, the unit computes and displays the Dew Point Temperature. The GDL features a display that allows the user to see the current temperature, humidity and dew point simultaneously.
DwyerLog User’s Guide Version 1.4x 24/33 (temperature, humidity and dew point). The icons provide a summary of the current state of the logger. • MEM: The Memory bar graph shows the amount of memory used and left in the logger. When logging starts, the bar graph is empty. It fills up as samples are stored into memory. The percentage display shows how much memory is used, as well.
DwyerLog User’s Guide Version 1.4x 25/33 logging. • Mem Left: Shows the length (in days, hours, minutes or seconds) of data the logger can record without overwriting currently recorded data (record without a rollover). If a rollover has occurred, this number will show 0 Sec, even though the logger may still be logging. GDL Graph Screen The GDL is capable of displaying the logged data graphically to show temperature and relative humidity trends. The GDL Graph screen is shown below.
DwyerLog User’s Guide Version 1.4x 26/33 Replacing the GDL Battery The GDL uses three AA type alkaline or lithium batteries. Using rechargeable Ni-MH batteries is not recommended. The battery level of the GDL is shown on the screen, or can be checked using the DwyerLog software, by opening the Logger Status window. It is suggested that the battery is replaced when the battery level reaches 1 bar on the display, or in the yellow zone in the DwyerLog software.
DwyerLog User’s Guide Version 1.4x 27/33 GDL Specifications Text Display Graph Display Sample Point Capacity Alarms Calibration Operating Temperature Storage Temperature Time Accuracy Relative Humidity Range Relative Humidity Accuracy Relative Humidity Resolution Temperature Accuracy Temperature Resolution Dimensions Weight Power Source Battery Life Displays real time temperature, humidity and dew point. Displays logging summary, sample rate, memory used and memory left.
DwyerLog User’s Guide Version 1.4x 28/33 To turn the logger On at any time, just press any of the loggers' buttons. The display will come back on and the logger will operate normally GDL-T Sample Screen There are a number of different screens that the user can switch between, using the View button. The Sample and Summary screens show the current status of the logger. The Graph screen shows a record of the logged temperature samples in memory. A typical four channel sample screen is shown below.
DwyerLog User’s Guide Version 1.4x 29/33 if the alarm condition goes away. See the Alarm Setup section in the Software User's Guide for more information on setting and using alarms. GDL-T Difference Screen When four channels are selected to log, or when the GDL-T is idle, the unit will display an additional temperature difference screen. The temperature difference is always displayed between the Internal Channel (Temp Int) and Channel 1 (Temp 1), and between Channel 2 (Temp 2) and Channel 3 (Temp 3).
DwyerLog User’s Guide Version 1.4x 30/33 GDL-T Graph Screen The GDL-T is capable of displaying the logged data graphically to show temperature trends. Two channels can be displayed at one time. The user can select the graphed channels in the Select Graph Channels screen: Use the Display + button to select the channels to graph. Note that only the logged channels (channels recorded in logger memory) can be graphed. The GDL-T Graph screen is shown below.
DwyerLog User’s Guide Version 1.4x 31/33 • Display +: Use this button to increase the screen contrast when in Sample and Summary screens. When in the Graph screen this button shifts the graph to the right. When in Graph Select screen, this button selects the channels to graph. • Display -: Use this button to decrease the screen contrast when in Sample and Summary screens. When in the Graph screen this button shifts the graph to the left.
DwyerLog User’s Guide Version 1.4x 32/33 ensure that water does not get into the unit. This is especially important in high humidity situations (90% RH and above) where water may condense inside the logger, causing damage to the internal electronics. Warning: Care must be taken to ensure that the logger is not operating under condensing conditions. This means that the dew point temperature must be below the ambient temperature. Condensation will damage the humidity sensor and the logger electronics.
DwyerLog User’s Guide Version 1.4x 33/33 MTL-20-LCD Specifications Display Sample Point Capacity Sample Rate Alarms Operating Temperature Storage Temperature Temperature Accuracy Temperature Resolution Calibration Time Accuracy Dimensions Weight Power Source Battery Life Displays real time temperature. Displays logging status and alarm status. 43,344 Temperature samples.. 1 second to 18 hours. Visual over and under temperature alarm indicator.