
Owner manual


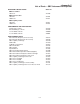


Table A-2-1
WITHIN-RUN PRECISION, QBC AUTOREAD PLUS SYSTEM
9
QBC VENOUS BLOOD TUBES
N = 10
per sample
HCT
HB MCHC PLT
WBC
#GRANS %GRANS
#L/M %L/M
SAMPLE 1
MEAN 47.6 15.9 33.5 155 7.1 4.6 65 2.5 35
%CV 1.87 0.74 2.17 8.91 3.16 2.71 2.02 5.86 3.78
SAMPLE 2
MEAN 23.1 7.4 31.8 288 6.7 4.9 73 1.8 27
%CV 1.44 0.66 1.22 3.27 2.33 3.07 1.41 3.69 3.85
SAMPLE 3
MEAN 31.9 10.4 32.5 550 11.2 7.9 71 3.3 29
%CV 1.5 1.27 1.29 3.59 5.41 7.3 2.86 6.49 6.96
SAMPLE 4
MEAN 52.3 16.3 31.1 745 16.1 10.6 66 5.6 34
%CV 1.4 1.35 0.96 4.68 6.42 5.86 1.43 8.09 2.77
SAMPLE 5
MEAN 41.6 13.6 32.8 91 5.3 3.6 68 1.7 32
%CV 1.73 1.45 0.8 5.34 6.72 6.2 1.85 9.02 4
QBC CAPILLARY BLOOD TUBES
N = 10
per sample
HCT
HB MCHC PLT
WBC
#GRANS %GRANS
#L/M %L/M
SAMPLE 1
MEAN 49.1 15.3 31.2 144 8.4 5.9 70 2.5 30
%CV 1.1 0.9 0.9 13.1 6.7 10.1 4.3 7.4 10.2
SAMPLE 2
MEAN 31.9 9.7 30.3 522 11.6 8.1 70 3.5 30
%CV 2.0 1.1 1.7 3.7 4.5 4.1 1.1 6.1 2.6
SAMPLE 3
MEAN 54.9 16.4 29.9 582 15.6 10.3 66 5.4 34
%CV 0.9 1.2 1.0 6.6 2.8 2.9 2.7 7.0 5.2
SAMPLE 4
MEAN 42.8 12.9 30.2 88 5.7 3.8 66 2 34
%CV 0.8 0.7 0.6 9.9 5.6 5.0 2.7 9.4 5.3
SAMPLE 5
MEAN 40.8 12.5 30.7 197 5.9 3.9 67 2 33
%CV 1.9 1.5 1.1 8.3 7.5 9.0 1.7 4.2 3.5
A-2.4 SPECIFIC PERFORMANCE
CHARACTERISTICS
A-2.4.1 Precision
Data on within-run reproducibility of the QBC
Autoread Plus System from five blood specimens with
QBC venous tubes and five blood specimens with
QBC capillary tubes are shown in Table A-2-1. The
means and%C.V.’sbelowarebasedonreplicate
tests of 10 tubes per sample; e.g., for Sample 1,
n=10, etc.
A-2-3